


Abstract
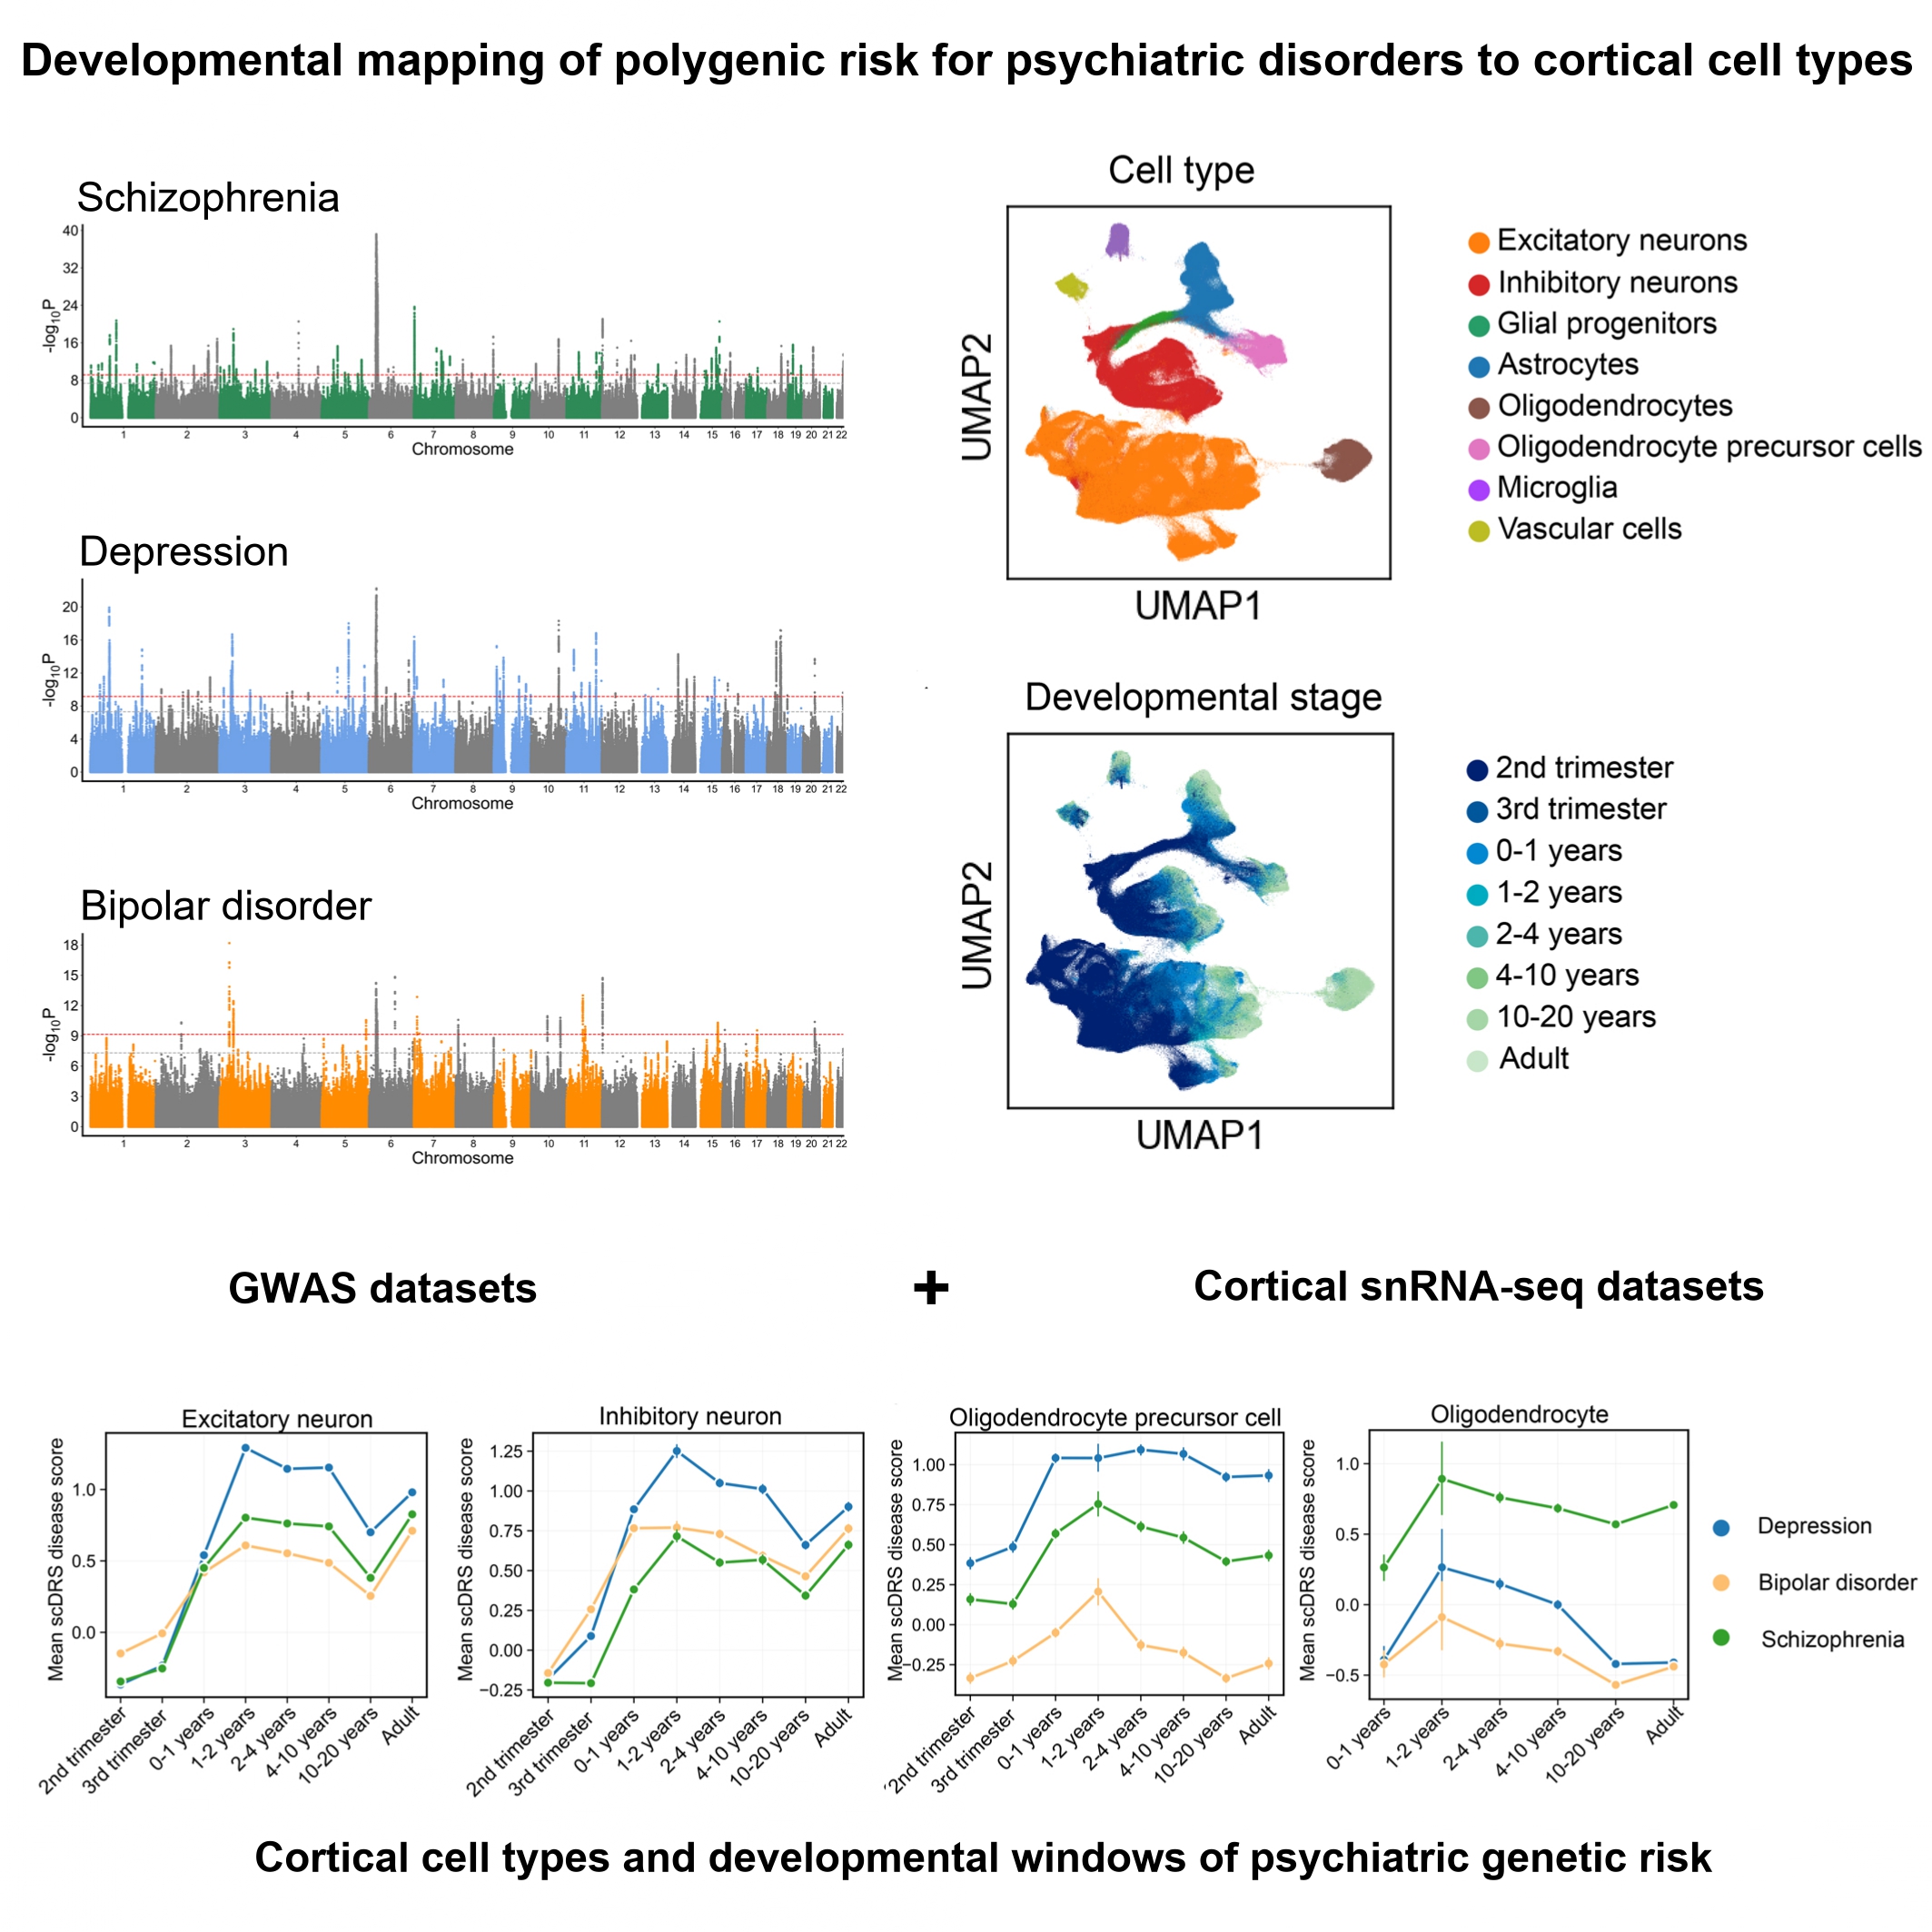
Schizophrenia, depression, and bipolar disorder are highly heritable psychiatric illnesses that share overlapping symptoms but also exhibit disorder-specific features. To dissect the cellular and developmental mechanisms underlying genetic risk, we integrated large-scale genome-wide association study (GWAS) data with human cortical single-nucleus RNA sequencing (snRNA-seq) data spanning gestation to adulthood (>700,000 nuclei from 106 donors). Gene-based analyses revealed 104 shared genes across disorders and convergent enrichment in synaptic pathways, alongside disorder-specific signals such as metal ion transport in schizophrenia. Using the single-cell disease relevance score (scDRS), we mapped polygenic risk across cortical cell types and developmental windows. Excitatory neurons were consistently implicated across all disorders from postnatal stages through adulthood, while inhibitory neurons showed broader vulnerability in depression and bipolar disorder, extending into the fetal period. Glial cells demonstrated disorder specificity: astrocytes were implicated across disorders during early postnatal synaptogenesis, oligodendrocyte precursor cells (OPCs) showed prolonged associations in depression, and mature oligodendrocytes were uniquely implicated in schizophrenia during childhood. These findings highlighted excitatory-inhibitory imbalance as a shared mechanism, alongside distinct glial and developmental trajectories contributing to disorder-specific pathophysiology. Our findings help to highlight the cortical cell types and developmental windows through which psychiatric genetic risk may act, offering insights into potential critical periods for intervention.
Keywords:Psychiatric disorders, Genome-wide association study (GWAS), Single-nucleus RNA sequencing (snRNA-seq), Cell type-specific risk, Neurodevelopmental trajectories.
Introduction
Schizophrenia, depression and bipolar disorder are highly burdensome psychiatric illnesses[1]. Despite their clinical heterogeneity, these disorders frequently exhibit comorbidity and overlapping symptoms[2, 3], which aligns with the dimensional-continuum models of psychiatric risk. These models conceptualize psychiatric illnesses along continuous dimensions rather than as discrete categories, emphasizing that multiple interacting domains, such as cognition and emotion, jointly contribute to psychiatric symptoms and their shared neurobiological basis[4-6]. Large-scale genome-wide association studies (GWASs) have revealed substantial genetic correlations across psychiatric disorders, suggesting a shared polygenic architecture as well as disorder-specific components[7-13]. While these genetic studies have uncovered hundreds of associated loci, the mechanisms by which risk variants act on specific cell types and developmental windows, as well as the similarities and differences of these mechanisms across diseases, remain incompletely understood.
The cerebral cortex constitutes a fundamental pathophysiological substrate for psychiatric disorders. It is essential for higher-order cognitive and emotional processes, and converging evidence from neuroimaging studies has demonstrated cortical abnormalities across schizophrenia, depression, and bipolar disorder[14-17]. Increasing evidence indicates that the effects of psychiatric risk variants are dependent on neurodevelopmental context, particularly during fetal and early postnatal stages[18-21]. For example, genetic risk factors for schizophrenia primarily act during early cortical development, perturbing neuronal circuit formation and synaptic organization in ways that predispose to later disease manifestation[18]. Moreover, shared genetic risk across psychiatric disorders has been shown to regulate genes expressed in developing neocortex during midgestation[21]. Therefore, linking polygenic risk to cortical cell types across developmental stages helps identify when and where genetic risk arises, providing insight into how psychiatric disorders develop.
Advances in single-nucleus RNA sequencing (snRNA-seq) now provide improved resolution to map gene expression across diverse cortical cell types and developmental stages[22, 23]. These datasets enable dissection of how disease-associated genes are expressed across different cell types and developmental stages. Integrating GWAS with single-cell transcriptomic data has emerged as a powerful approach to link genetic risk with cellular contexts[24, 25]. In particular, the single-cell disease relevance score (scDRS) framework allows polygenic risk to be projected onto individual cells, thereby quantifying disease relevance across cell types and developmental time[26].
In this study, we integrated GWAS summary statistics of schizophrenia, depression, and bipolar disorder with large-scale human cortical snRNA-seq data spanning from the second trimester of gestation to adulthood. We aimed to identify shared and disorder-specific genes and pathways, determine the cellular and developmental distribution of polygenic risk, and disentangle common versus distinct biological mechanisms across major psychiatric disorders.
Materials and Methods
GWAS datasetsTo investigate the cellular mechanisms through which genetic risk contributes to major psychiatric disorders, we analyzed GWAS summary statistics of European ancestry for depression (Ncase = 294,322, Ncontrol = 741,438)[8], bipolar disorder (Ncase = 41,917, Ncontrol = 371,549)[9] and schizophrenia (Ncase = 53,386, Ncontrol = 77,258)[7]. For depression, cases were defined based on multiple criteria, including the International Classification of Diseases (ICD), self-reported depression, or questionnaire-based assessments. Control participants were drawn from population-based cohorts, excluding individuals with any diagnosis of depression. For bipolar disorder, all cases met international diagnostic criteria, including the Diagnostic and Statistical Manual of Mental Disorders (DSM) and ICD, while controls had no psychiatric history. For schizophrenia, diagnoses were based on DSM or ICD criteria, structured clinical interviews, medical record reviews, consensus diagnoses, and scale-assisted assessment. Controls were individuals without a history of psychiatric disorders or were randomly selected from the population. As these GWAS represent meta-analyses of multiple cohorts, detailed information on study design, diagnostic procedures, and quality control is available in the original publications.
Human cortex single-nucleus RNA sequencing dataset from gestation to adulthoodWe used snRNA-seq gene expression data from human cerebral cortex, spanning developmental stages from the second trimester of gestation to adulthood (fourth last menstrual period month human stage to 54 years old). The study analyzed >700,000 single-nucleus RNA sequencing profiles from 106 donors (45 female and 61 male subjects)[23]. The developmental stages included the second trimester of gestation (31 donors), the third trimester of gestation (12 donors), 0-1 years (11 donors), 1-2 years (4 donors), 2-4 years (10 donors), 4-10 years (8 donors), 10-20 years (17 donors) and adulthood (>20 years,13 donors). Preprocessing of the snRNA-seq data was carried out using Scanpy (single-cell analysis in python, v 1.10.1, http://scanpy.readthedocs.io/en/stable/index.html)[27]. Each cell was assigned a predefined cell type and developmental stage[23]. The cell types included excitatory neurons, inhibitory neurons, glial progenitors, astrocytes, oligodendrocyte precursor cells (OPCs), oligodendrocytes, microglia, and vascular cells. We filtered out cells expressing fewer than 250 genes and genes expressed in fewer than 50 cells, 704,080 single nuclei transcriptome profiles × 17,589 genes remained in the snRNA-seq data. Following the filtering, we normalized the snRNA-seq data matrix. Each cell was normalized by total counts over all genes, enabling comparison of gene expression levels across cells. The normalized data matrix was then logarithmized to stabilize variance for further analyses. Batch correction was applied to the dataset[23], with gene counts and sex included as covariates for the scDRS analysis.
MAGMAMAGMA (v1.10, https://cncr.nl/research/magma/)[28] was used to construct gene sets for schizophrenia, depression, and bipolar disorder based on GWAS summary statistics. We performed these analyses using genome-wide summary data. Gene boundaries were defined based on Ensembl release 102 (GRCh37) and extended by 35 kb upstream and 10 kb downstream to incorporate potential regulatory regions. Linkage disequilibrium was estimated from the European reference panel of the 1000 Genomes Project (Phase 3)[29]. Gene-based association testing was performed in MAGMA using the SNP-wise Mean model. Gene-level P-values were derived from the exact distribution of the sum of squared z-scores using the Imhof method and were subsequently converted to gene-level z-scores. For each disorder, the top 1,000 genes with the highest MAGMA gene-level z-scores were selected, restricting to genes that passed quality control in the snRNA-seq dataset.
Over-representation analysisTo investigate the functional enrichment of disorder-associated genes, over-representation analysis was conducted for each disorder using the ToppGene Suite (https://toppgene.cchmc.org/)[30]. For each over-representation analysis, the input gene set comprised the top 1,000 genes ranked by MAGMA gene-level z-scores, which were tested against the ToppGene Suite's default background of all genes annotated for Gene Ontology (GO) biological process terms (n = 20,557). In this analysis, we specifically selected the GO biological process database, as our primary objective was to clarify and compare the biological processes underlying the genetic architecture of schizophrenia, depression, and bipolar disorder. Restricting the analysis to a single database also helped minimize gene set redundancy and reduced the inflated burden of multiple testing. Statistical significance was assessed using a hypergeometric test, and P-values were adjusted for multiple testing using the Bonferroni correction.
Single-cell disease relevance score (scDRS)We used scDRS (v1.0.4, https://github.com/martinjzhang/scDRS)[26] to investigate the cellular targets of schizophrenia, depression, and bipolar disorder through polygenic score at single-cell resolution. For each snRNA-seq cell, scDRS computed a disease relevance score by aggregating the expression of the top 1,000 associated genes (default parameter setting in scDRS), followed by normalization. To determine statistical significance, 1,000 sets of Monte Carlo control scores were generated and normalized. One-sided cell-level P values were computed by comparing each cell’s normalized disease relevance score to the empirical distribution of control scores. Uniform Manifold Approximation and Projection (UMAP, v0.5.6)[31] is a nonlinear dimensionality reduction technique, which was used for visualizing the structure of snRNA-seq data in two dimensions. Cell type-level analyses aggregated individual cell-level results to identify cell types associated with the three psychiatric disorders. Although scDRS retains sufficient power even for small cell numbers[26], we excluded cell types in specific developmental stages with fewer than 50 cells. Consequently, scDRS results for 704,072 single nuclei were retained for cell type-level analyses. Each cell was assigned to a unique combination of cell type and developmental stage based on its annotation; therefore, no cell was counted in more than one category. P values for both cell-level and cell-type level analyses were adjusted using false discovery rate (FDR) correction to control for multiple hypothesis testing.
Sensitivity analysis of gene selection thresholdTo assess the robustness of our results to gene selection criteria, we performed sensitivity analyses using alternative threshold for MAGMA-prioritized genes per disorder. In the original scDRS study[26], six strategies were evaluated, including the top 100, 500, 1,000, 2,000, as well as those based on family-wise error rate (FWER) < 5%, and FDR < 1%. The default top 1,000 gene set substantially outperformed all other versions, except for the top 2,000 gene set, which showed comparable performance but slightly poorer calibration. Therefore, we selected the top 2,000 gene set for sensitivity analysis to further validate the robustness of our findings.
Results
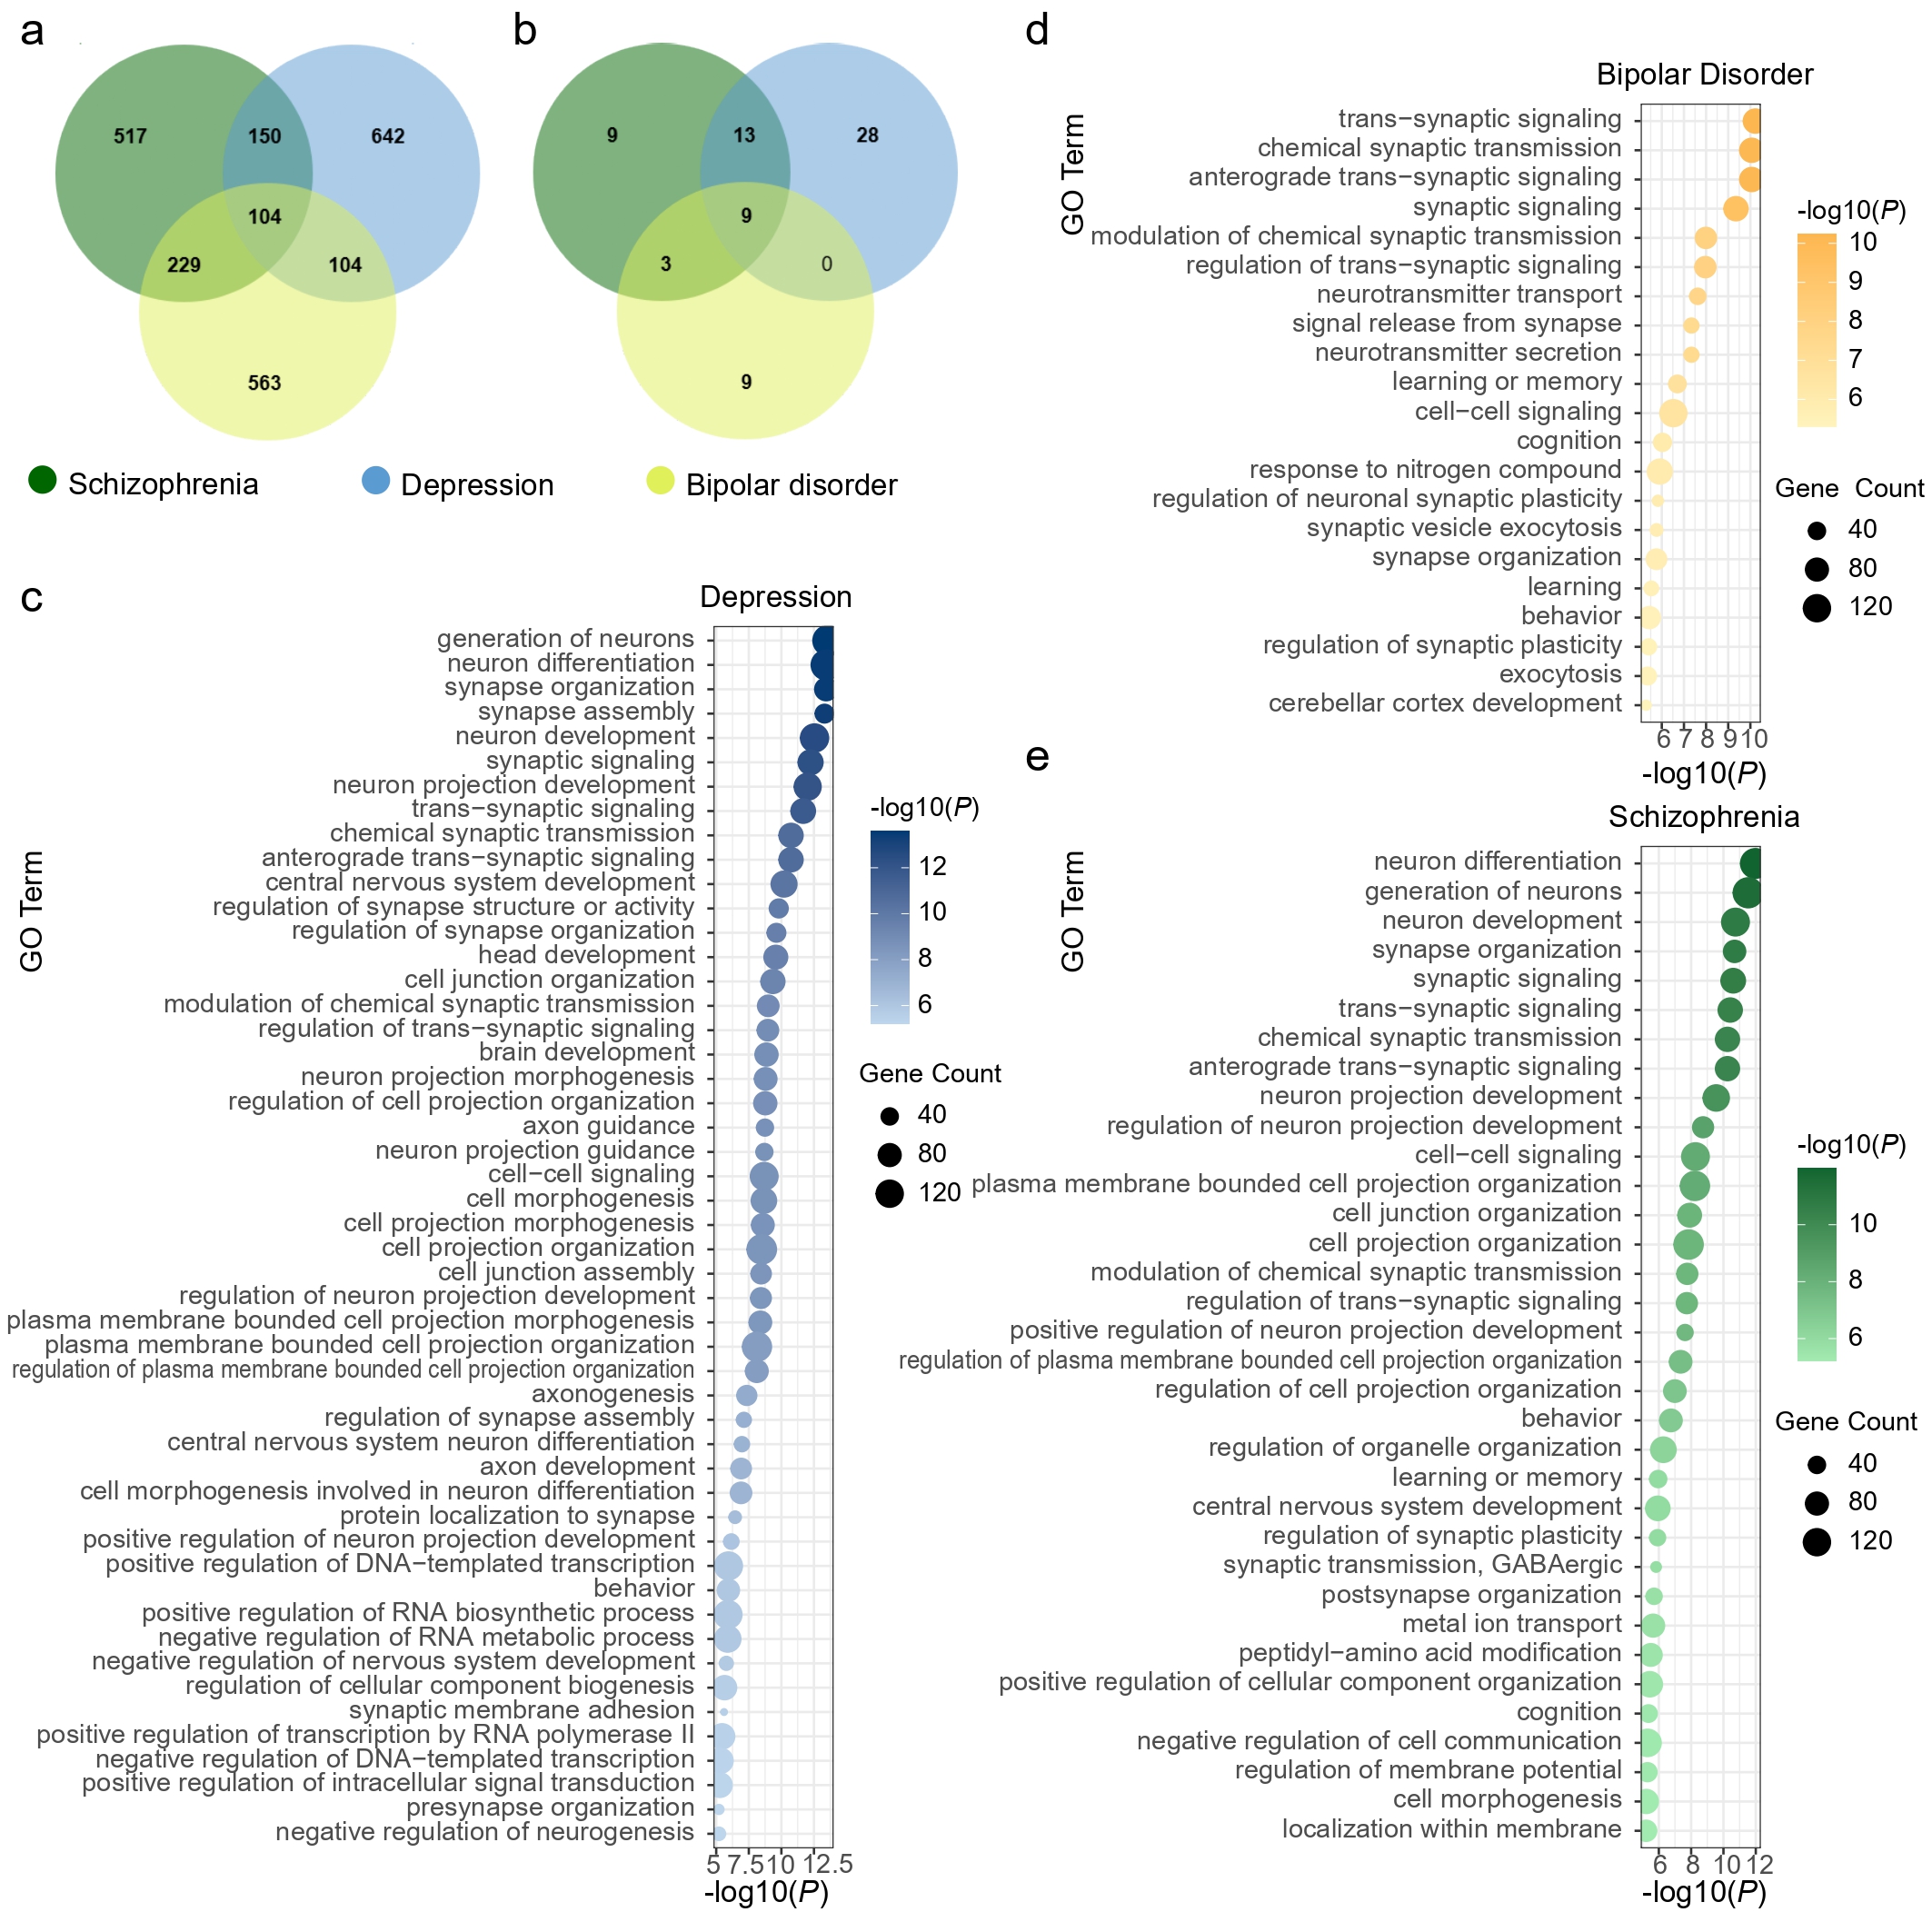
Disease-associated genes and pathwaysFor each disorder, we extracted the top 1,000 associated genes and assessed their overlap (Supplementary Table 1 and Fig. 1a). A total of 104 genes were shared across schizophrenia, depression, and bipolar disorder, highlighting their pleiotropic genetic architecture, whereas 517, 642, and 563 genes were disorder-specific for schizophrenia, depression, and bipolar disorder, respectively. Pathway enrichment analysis (Bonferroni-corrected P < 0.05) identified 34 pathways for schizophrenia (Supplementary Table 2), 50 for depression (Supplementary Table 3), and 21 for bipolar disorder (Supplementary Table 4), with nine shared pathways primarily related to synaptic processes (Fig. 1b-e), such as synapse organization (Pc = 1.52 × 10⁻⁷ for schizophrenia, Pc = 2.67 × 10⁻¹⁰ for depression, Pc = 1.24 × 10⁻² for bipolar disorder) and synaptic signaling (Pc = 1.85 × 10⁻⁷ for schizophrenia, Pc = 4.19 × 10⁻⁹ for depression, Pc = 3.18 × 10⁻⁶ for bipolar disorder). Depression- and schizophrenia-associated pathways were enriched for generation of neurons (Pc = 2.17 × 10⁻⁸ for schizophrenia, Pc = 1.87 × 10⁻¹⁰ for depression) and neuron differentiation (Pc = 7.80 × 10⁻⁹ for schizophrenia, Pc = 2.66 × 10⁻¹⁰ for depression), while schizophrenia- and bipolar disorder shared enrichment in regulation of synaptic plasticity (Pc = 8.87 × 10⁻³ for schizophrenia, Pc = 2.79 × 10⁻² for bipolar disorder). Schizophrenia-specific pathways were significantly enriched in GABAergic synaptic transmission (Pc = 1.09 × 10⁻²) and metal ion transport (Pc = 1.67 × 10⁻²). These findings reveal both shared and disorder-specific molecular mechanisms, with convergent enrichment in synaptic pathways across disorders, and schizophrenia showing additional specificity in GABAergic transmission and ion transport.
Figure 1. Gene- and pathway-level analyses of three psychiatric disorders. a. Venn diagram shows the number of genes identified by gene-based association tests and their overlap among the three psychiatric disorders. b. Venn diagram shows the number of pathways identified by statistical over-representation analysis and their overlap among the three disorders. c-e, Bubble plots display the enriched Gene Ontology (GO) biological process terms (Bonferroni-corrected P < 0.05) for depression (c), bipolar disorder (d), and schizophrenia (e). The x-axis represents the significance level of each term, while the y-axis lists the GO terms. Bubble color indicates significance, and bubble size represents the number of genes enriched in each term.
We next applied scDRS analysis to snRNA-seq data spanning eight major brain cell types (Fig. 2a) across eight developmental stages (Fig. 2b). First, we calculated a scDRS for each cell in the snRNA-seq datasets based on the genes associated with schizophrenia, depression, and bipolar disorder, and projected these scores onto UMAP plot (Fig. 2c). At the single-cell level, scDRS showed that genes associated with all three psychiatric disorders were highly expressed in excitatory and inhibitory neurons, particularly during postnatal stages. Schizophrenia and depression genes also exhibited elevated scDRS in OPCs, while schizophrenia genes showed higher scDRS in mature oligodendrocytes compared with depression and bipolar disorder.
Figure 2. Associations of human cortical cells with risk genes for schizophrenia, depression, and bipolar disorder. a-b, UMAP (uniform manifold approximation and projection) visualization of human cortical cells, with cluster labels indicating annotated cell types (a) and developmental stages (b). c, UMAP visualizations display the disease relevance score for schizophrenia, depression and bipolar disorder assigned to each cell. d, Cell type-level scDRS analysis for the three psychiatric disorders. The y-axis represents the -log 10 (P values) of the cell type-level analyses of human cortical cells for the three psychiatric disorders, grouped by cell types and developmental stages (x-axis, with number of cells indicated in parentheses). Asterisks denote significant cell type-disease associations (FDR < 0.05 across 56 cell types in different developmental stages). ExN, excitatory neuron; InN, inhibitory neuron; GPC, glial progenitor cell; Astro, astrocyte; OPC, oligodendrocyte precursor cell; Oligo, oligodendrocyte; Micro, microglia; VASC, vascular cell.
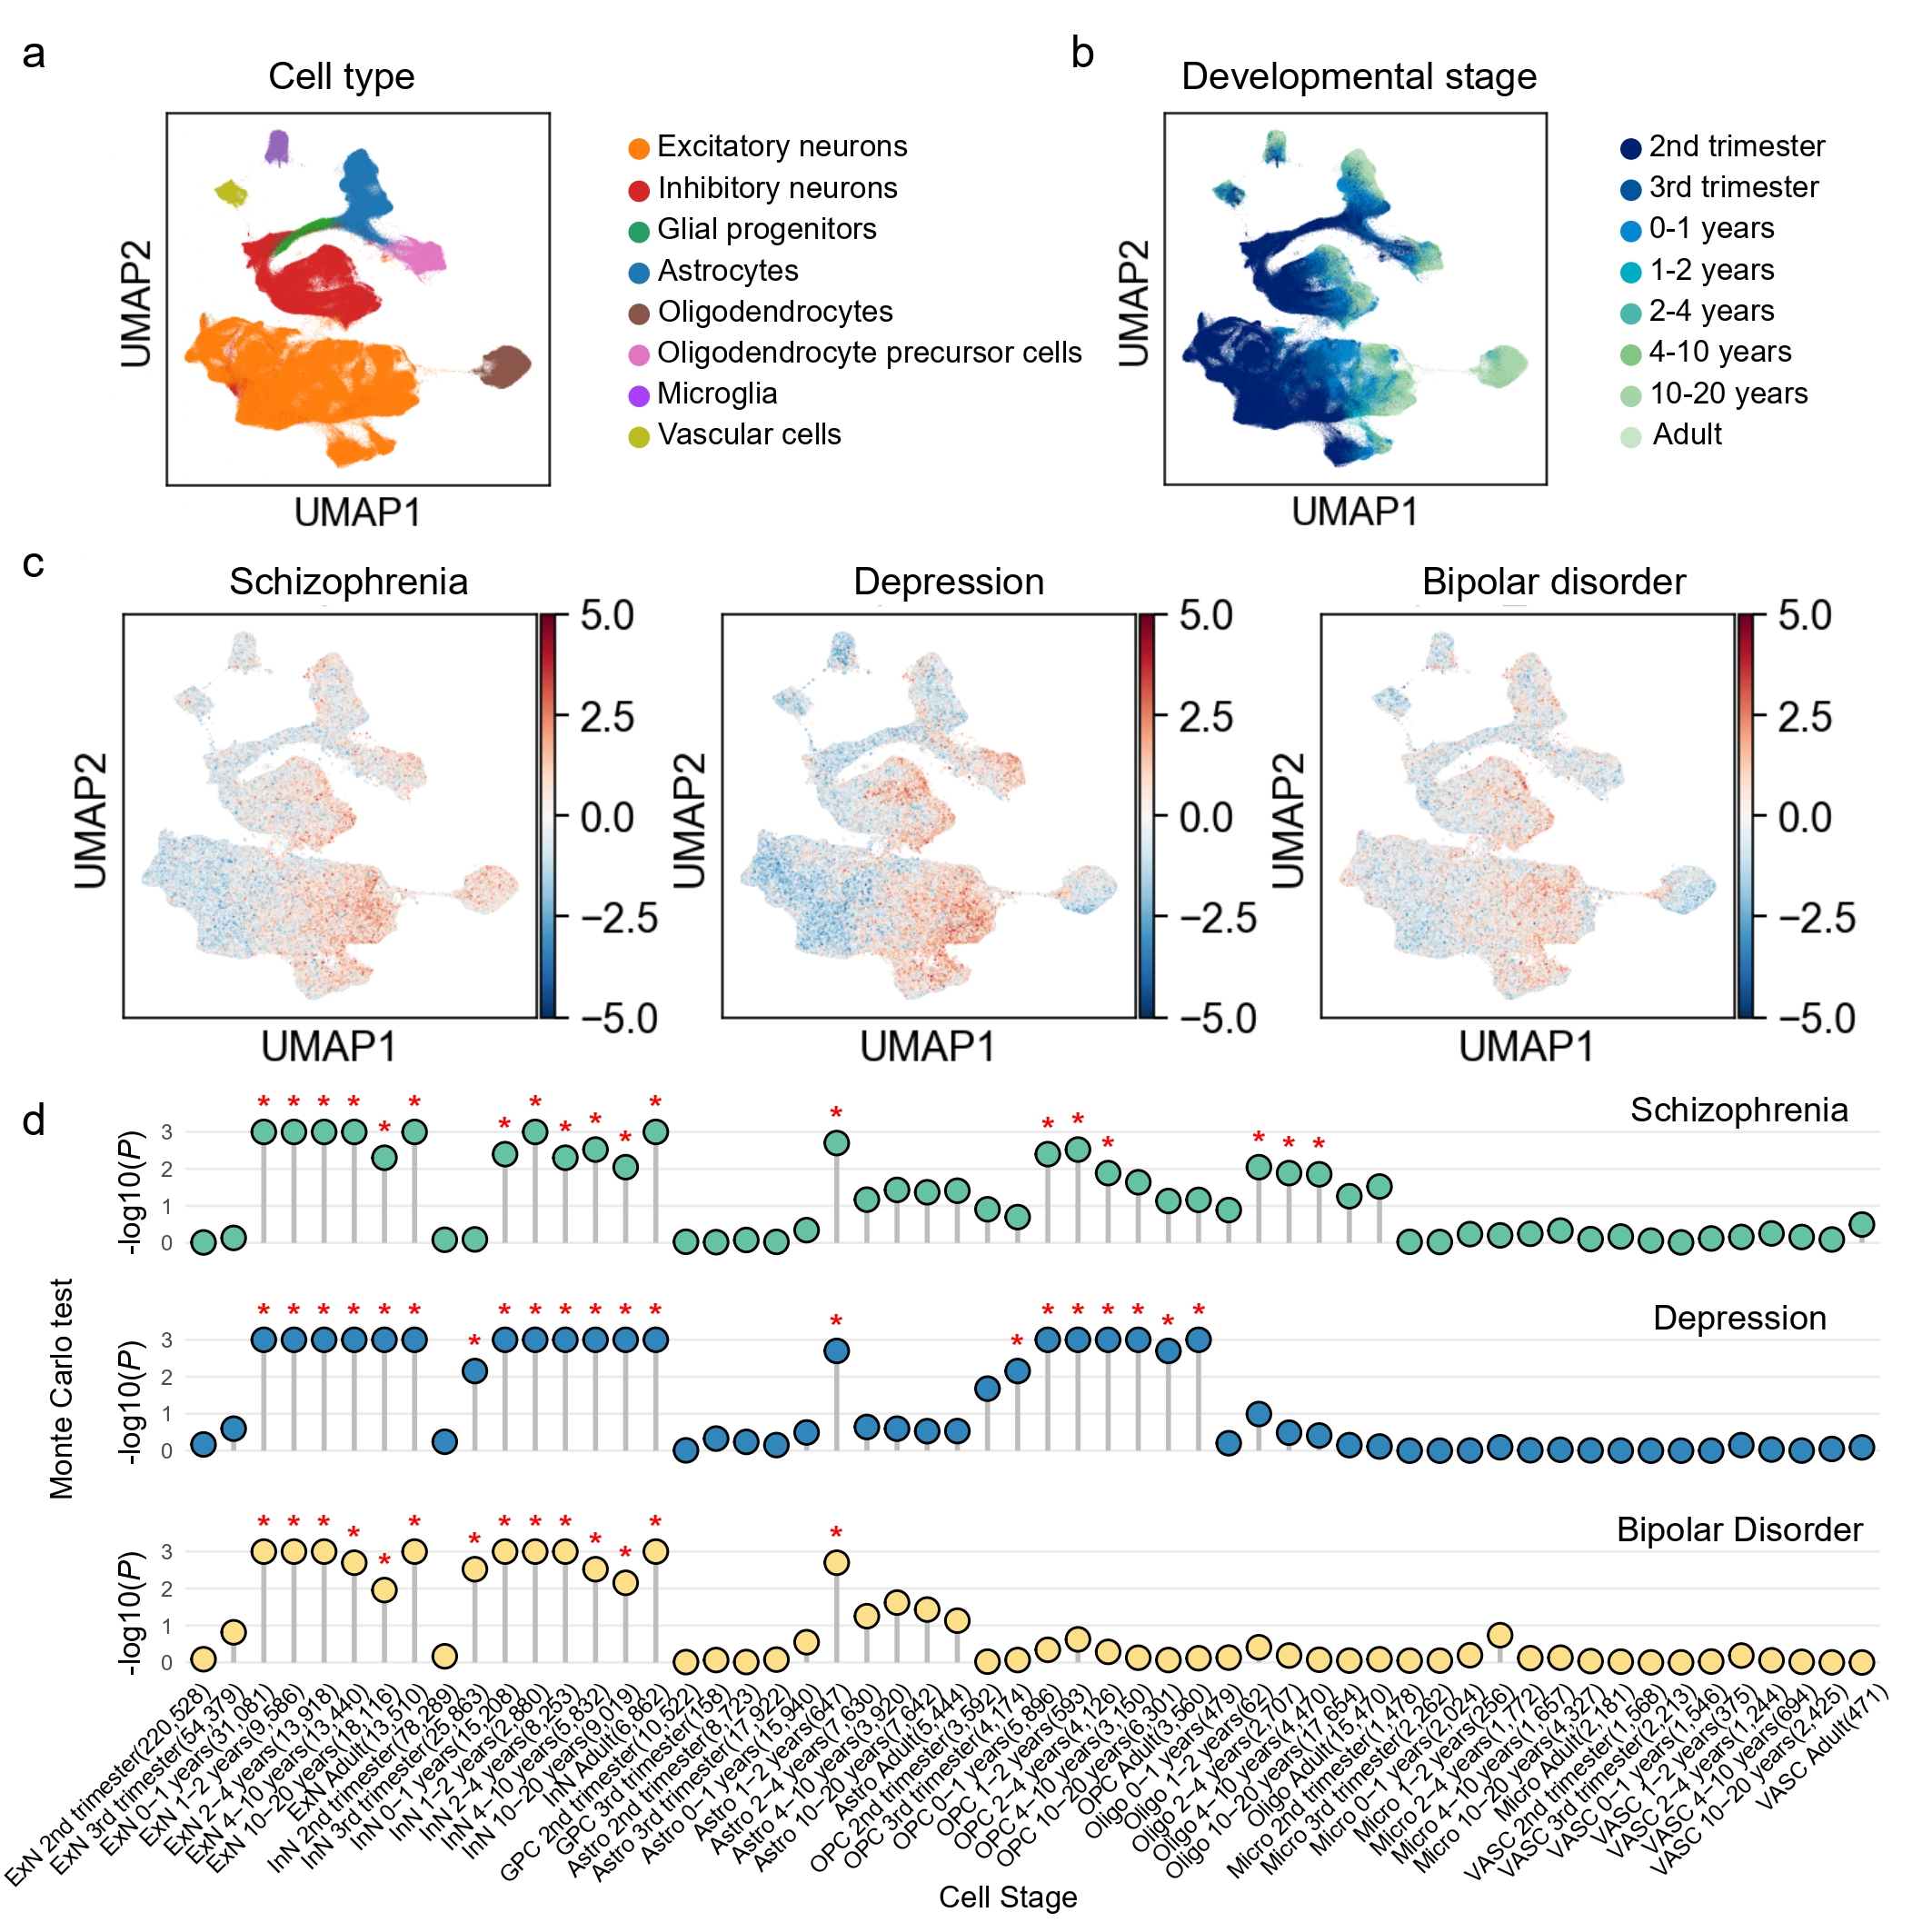
We then performed cell-type-level analyses to associate predefined cell types at different developmental stages with these disorders. In total, the analyses identified 19 significant cell type-schizophrenia pairs, 21 for depression, and 14 for bipolar disorder (FDR < 0.05, Monte Carlo test; Supplementary Tables 5-7). The analysis demonstrated that excitatory neurons were associated with schizophrenia, depression, and bipolar disorder spanning the postnatal period through adulthood. All three disorders were also significantly associated with inhibitory neurons, but with distinct temporal windows. In schizophrenia, inhibitory neuron associations were mainly postnatal, whereas in depression and bipolar disorder, associations extended from the third trimester through adulthood (Fig. 2d). These results emphasized that excitatory and inhibitory neuronal dysfunction was recognized as a foundational element across major psychiatric disorders. The broader vulnerability window may reflect the early involvement of GABAergic interneurons in depression and bipolar disorder. Our findings emphasized the temporal association of excitatory and inhibitory neurons with schizophrenia, depression, and bipolar disorder during the postnatal period. This observation aligned with the developmental trajectories of glutamatergic synapse density, dendritic arborization, and mesocortical dopaminergic projections, all of which continue to mature after birth[18], thereby underscoring the critical role of neural circuit development in the pathophysiology of schizophrenia, depression, and bipolar disorder.
Glial cells demonstrated disorder-specific associations. Astrocytes were consistently associated with all three disorders during the 1-2 years stage, a period coinciding with active synaptogenesis[32, 33] and gliogenesis[34, 35], highlighting the importance of early postnatal glial maturation for neurodevelopmental vulnerability to psychiatric disorders. OPCs were linked to schizophrenia and depression, with depression spanning from the third trimester through adulthood, while schizophrenia was restricted to 0-4 years (Fig. 2d). Mature oligodendrocytes were only associated with schizophrenia during 1-10 years. OPCs could differentiate into mature oligodendrocytes to form myelin sheaths, support axonal metabolism, and participate in neuroplasticity[36]. The distinct temporal patterns observed for oligodendrocyte lineage cells suggest disorder-specific vulnerabilities in white matter development. The prolonged association for depression may reflect impaired differentiation or maintenance of OPCs, consistent with reports of widespread white matter abnormalities and disrupted oligodendrocyte function in depression[36]. Schizophrenia was associated not only with OPCs within a narrow window (0-4 years) but also subsequently with mature oligodendrocytes. These findings highlight a critical developmental period during which disrupted myelination may compromise long-range connectivity, consistent with the neurodevelopmental model of schizophrenia[37, 38]. Together, these results suggest that depression may be characterized by chronic deficits in OPCs function, while schizophrenia reflects postnatal developmental failures in oligodendrocyte maturation and myelination. This distinction underscores the importance of temporally resolved glial mechanisms in contributing to disorder-specific pathophysiology.
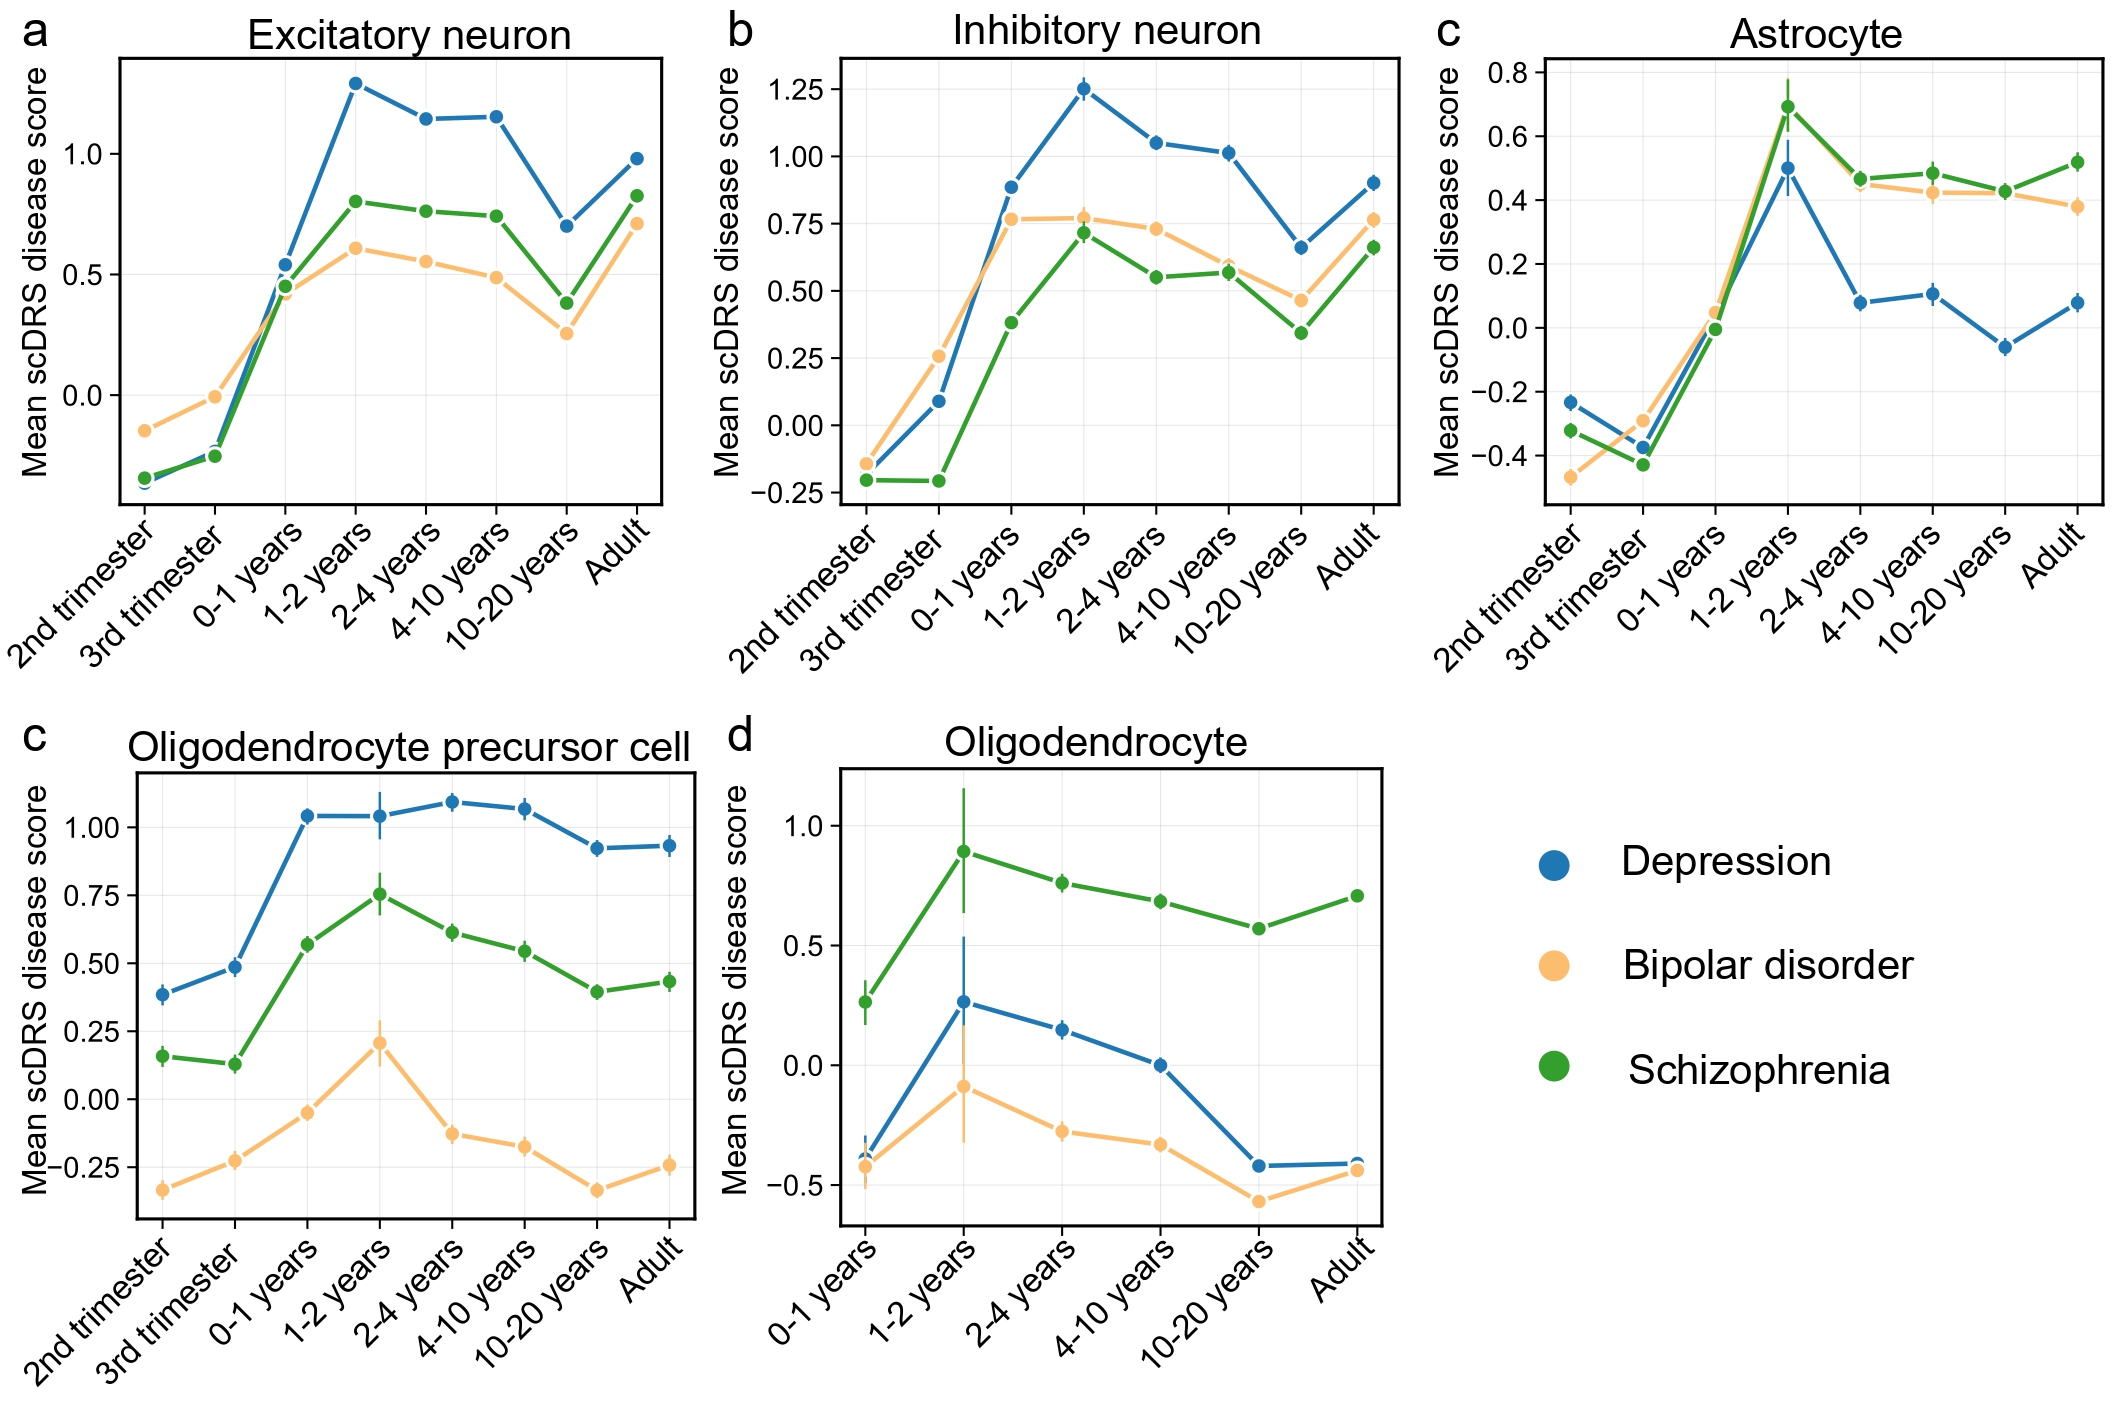
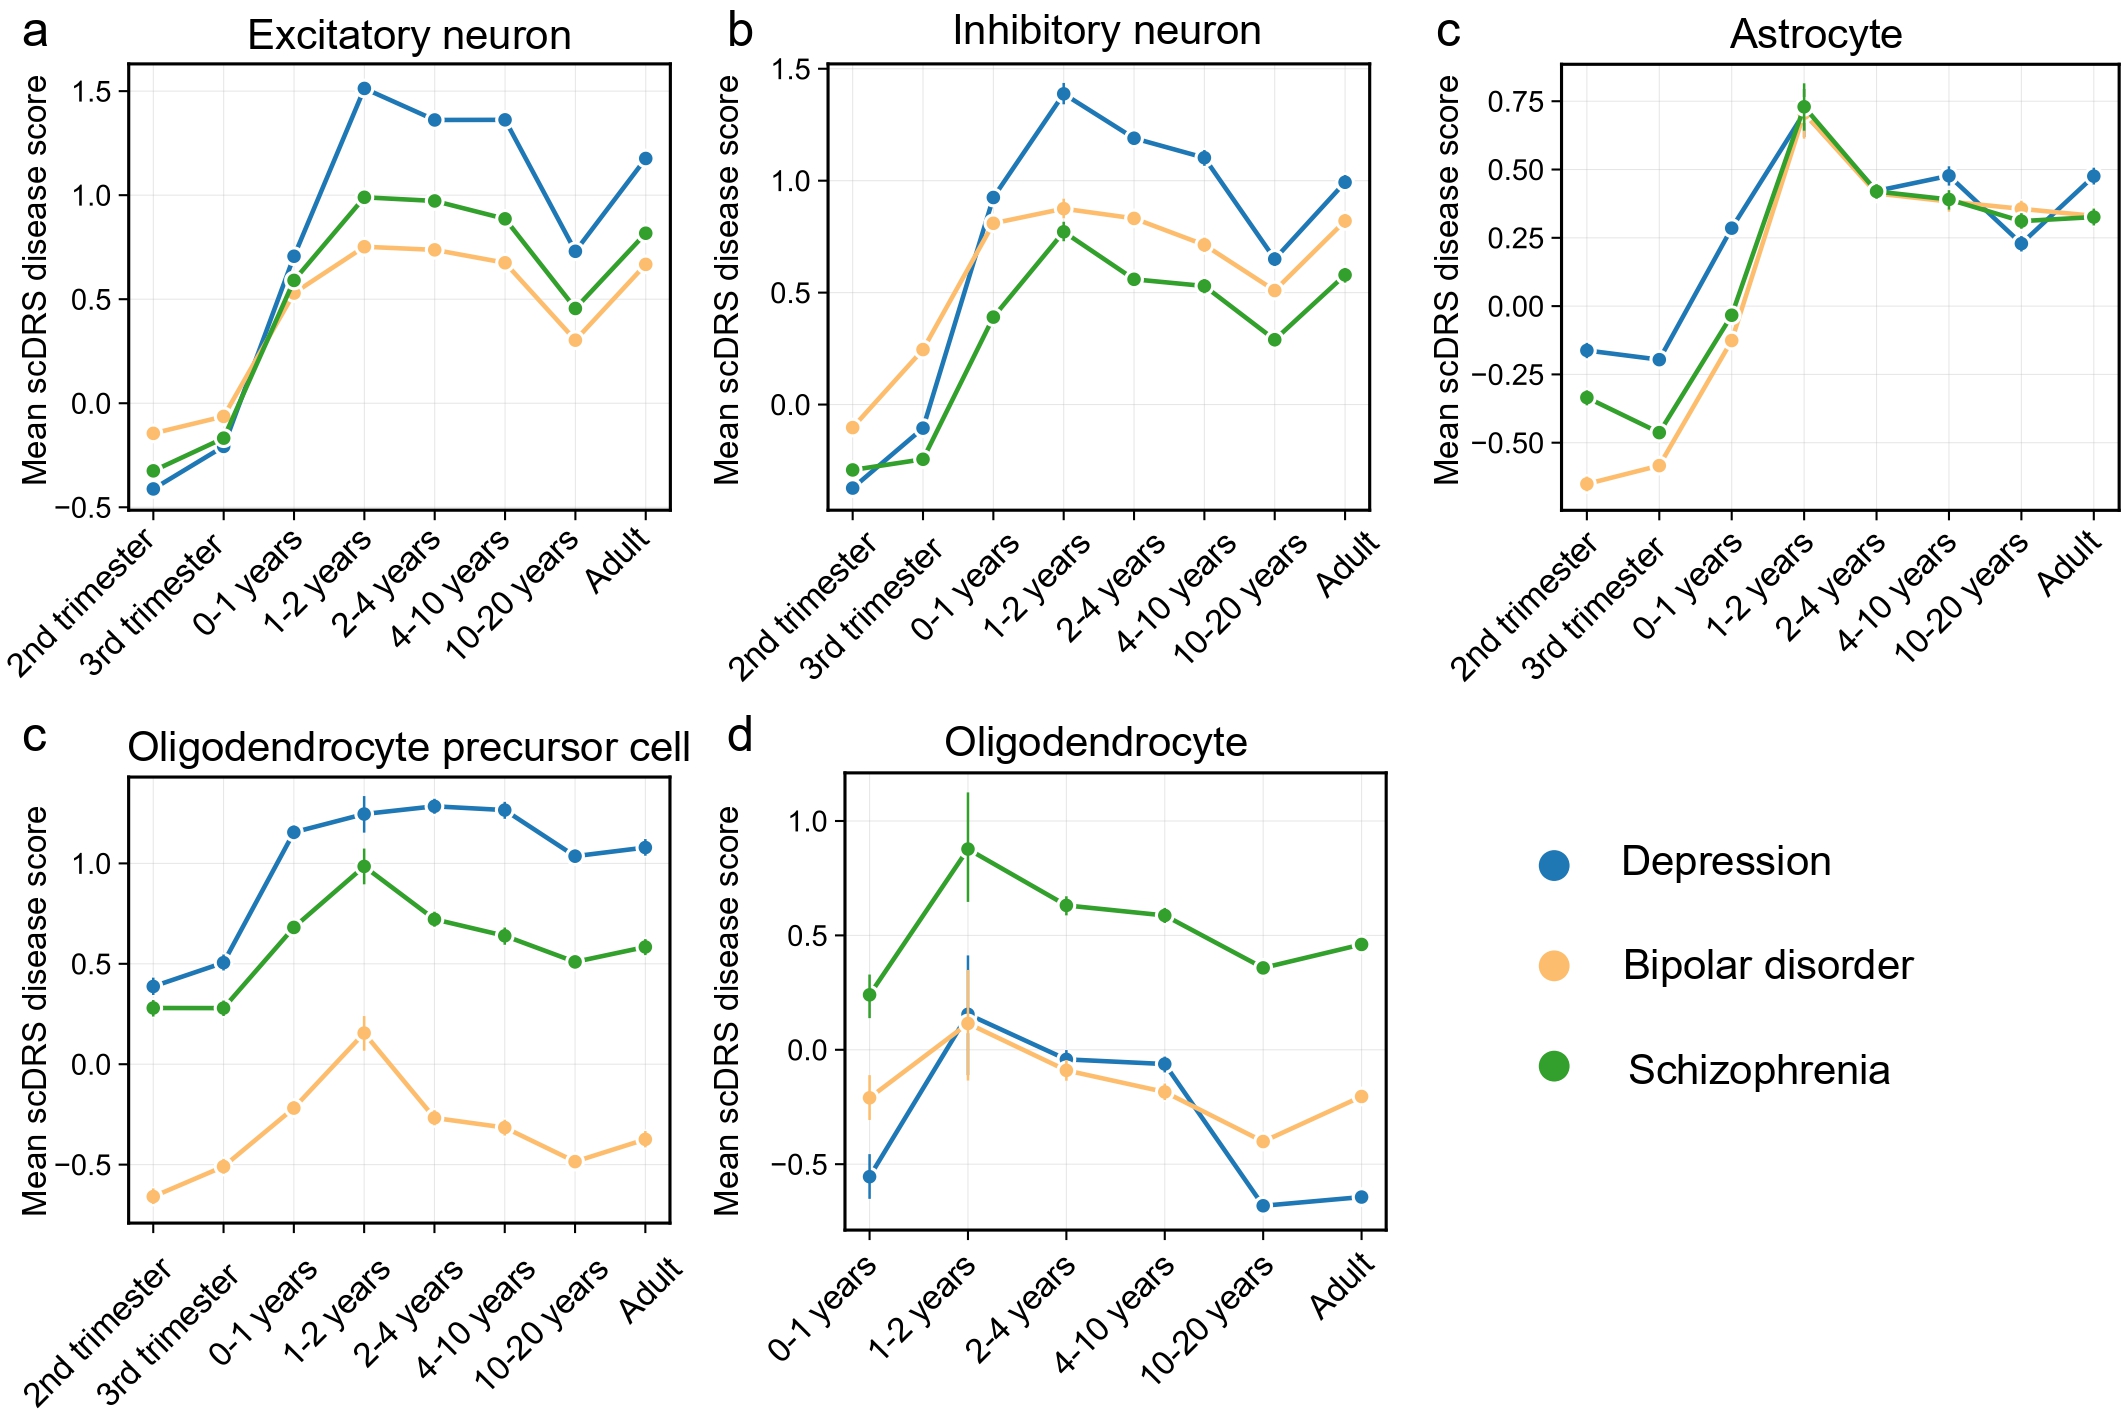
Disorder-specific scDRS trajectories across cell types and developmental windowsWe next compared average scDRS scores for schizophrenia, depression, and bipolar disorder across developmental stages in the associated cell types (Fig. 3). In both excitatory and inhibitory neurons, depression exhibited the highest postnatal scDRS scores, with a pronounced peak during the 1-2 years stage. In astrocytes, all three disorders demonstrated scDRS peaks during 1-2 years. Striking differences were observed in OPCs, where depression consistently showed the highest scores across the lifespan, followed by schizophrenia and then bipolar disorder, highlighting more persistent OPCs vulnerability in depression. By contrast, in mature oligodendrocytes, schizophrenia exhibited the highest scores, providing strong support for the established model of myelination deficits and white matter abnormalities as central pathophysiological features of schizophrenia[37, 38].
Figure 3. Developmental trajectories of scDRS in human cortical cells for three psychiatric disorders. These plots display the average scDRS (y-axis) for schizophrenia, depression, and bipolar disorder in five major cortical cell types: excitatory neuron (a), inhibitory neuron (b), astrocyte (c), oligodendrocyte precursor cell (OPCs, d), and oligodendrocyte (e). The developmental window spans from the second trimester of gestation to adulthood (x-axis). Prenatal stages for oligodendrocyte were excluded due to low cell counts (n < 50).
To evaluate the robustness of our findings to the choice of gene selection threshold in scDRS, we performed a sensitivity analysis using the top 2,000 MAGMA-prioritized genes. The developmental trajectories of scDRS derived from top 2,000 MAGMA-prioritized genes were highly consistent with our primary analysis based on the top 1,000 genes (Fig. 4). Although the larger gene set yielded slightly attenuated calibration, the developmental trajectories of scDRS and the distinctions between disorders remained largely consistent, indicating that our findings are robust to variations in gene selection strategy.
Figure 4. Developmental trajectories of scDRS across human cortical cell types for three psychiatric disorders using the top 2,000 disease-related genes. These plots display the average scDRS (y-axis) for schizophrenia, depression, and bipolar disorder in five major cortical cell types: excitatory neuron (a), inhibitory neuron (b), astrocyte (c), oligodendrocyte precursor cell (OPCs, d), and oligodendrocyte (e). The developmental window spans from the second trimester of gestation to adulthood (x-axis). Prenatal stages for oligodendrocyte were excluded due to low cell counts (n < 50).
Discussion
Our integrative analysis provides novel insights into the cell type- and developmental stage-specific mechanisms underlying schizophrenia, depression, and bipolar disorder. At the gene and pathway level, we observed a substantial overlap of associated genes and convergent enrichment in synaptic processes, consistent with the view that synaptic dysfunction is a core feature across major psychiatric disorders[39]. At the same time, disorder-specific enrichments, such as metal ion transport for schizophrenia, point to unique pathophysiological features.
At the cellular level, excitatory neurons were consistently implicated across disorders from postnatal stages through adulthood, underscoring glutamatergic dysfunction as a shared substrate of psychiatric illness. Inhibitory neurons also showed significant associations, but with broader temporal vulnerability in depression and bipolar disorder, extending back to the fetal period. This aligns with prior studies reporting a widespread excitatory-inhibitory imbalance in these conditions[40-42]. Together, these results emphasize that excitatory-inhibitory imbalance is a unifying mechanism, but with disorder-specific developmental timing.
Glial cell associations demonstrated greater disorder specificity. Astrocytes were consistently implicated across disorders during the 1-2 years, coinciding with peaks in synaptogenesis and gliogenesis[32-35]. OPCs showed prolonged associations in depression, suggesting persistent progenitor dysfunction, whereas schizophrenia was linked to a narrower early childhood window, with mature oligodendrocytes uniquely implicated. This distinction suggests that depression may involve chronic impairments in OPC differentiation or maintenance, while schizophrenia reflects postnatal developmental failures in oligodendrocyte maturation and myelination, consistent with white matter abnormalities observed in these disorders[36, 43].
A key limitation of our study is that we rely on snRNA-seq data from healthy human brains to annotate disease risk. This approach assumes that the transcriptional and regulatory relationships captured in healthy tissues largely reflect those in disease states, an assumption commonly adopted due to the limited availability of high-quality disease-specific single-cell datasets resources. However, disease-related changes, such as altered cell composition, cell-state transitions, and regulatory network remodeling, may influence the generalizability of our findings. Accordingly, our findings should be interpreted as reflecting putative risk-enriched cell types under baseline conditions rather than direct causal effects in disease states. Future studies incorporating disease-specific single-cell datasets will be essential to refine these interpretations. Furthermore, although a smaller number of cells should not substantially affect the scDRS power, the imbalance in the number of cells captured across cell types and developmental stages may introduce potential biases in estimating disease-associated cell types. These proportions not only reflect the intrinsic cellular composition of the human cerebral cortex at different developmental stages but are also influenced by variation in the number of donors contributing to each stage.
Overall, our findings highlight both convergent and distinct neurodevelopmental trajectories across psychiatric disorders, emphasizing the importance of temporally resolved analyses to disentangle shared and disorder-specific mechanisms. This cellular and developmental mapping of polygenic risk may inform strategies for targeted interventions at critical windows of vulnerability.
Abbreviations
DSM: Diagnostic and Statistical Manual of Mental Disorders; FDR: False Discovery Rate; FWER: Family-Wise Error Rate; GO: Gene Ontology; GRCh37: Genome Reference Consortium Hu-man Build 37; GWAS: Genome-Wide Association Study; ICD: In-ternational Classification of Diseases; OPCs: Oligodendrocyte Precursor Cells; scDRS: Single-Cell Disease Relevance Score; snRNA-seq: Single-Nucleus RNA Sequencing; SNP: Single Nu-cleotide Polymorphism; UMAP: Uniform Manifold Approxima-tion and Projection.
Supplementary Materials
Declarations
Author Contributions
N.L. conceived and designed the study. Y.L. and S.W. performed data preprocessing and statistical analyses. J.T. contributed to data interpretation and manuscript revision. N.L. drafted the manuscript with input from all authors. All authors read and approved the final manuscript.
Acknowledgment
We are grateful to the Psychiatric Genomics Consortium for providing GWAS summary statistics of schizophrenia, depression, and bipolar disorder. We thank Dmitry Velmeshev et al. for generating and sharing the single-nucleus RNA sequencing dataset of prenatal and postnatal human cortical development, which was essential for this study.
Funding Information
This work was supported by the Tianjin Municipal Health Commission Science and Technology Project (Grant No. TJW-J2025QN006).
Ethics Approval and Consent to Participate
This study used publicly available GWAS summary statistics and previously published single-nucleus RNA sequencing datasets. No new human participants or animal subjects were recruited, and therefore no additional ethics approval or in-formed consent was required.
Competing Interests
The authors declare no competing interests.
Data Availability
The GWAS summary statistics for schizophrenia, depression, and bipolar disorder are available from the Psychiatric Genomics Consortium (https://pgc.unc.edu/). The single-nucleus RNA sequencing dataset of prenatal and postnatal human cortical development is available from the original publication (Velmeshev et al., Science, 2019).
References
 Figures
 References
 Peer
Peer Information
Figure 1. Gene- and pathway-level analyses of three psychiatric disorders. a. Venn diagram shows the number of genes identified by gene-based association tests and their overlap among the three psychiatric disorders. b. Venn diagram shows the number of pathways identified by statistical over-representation analysis and their overlap among the three disorders. c-e, Bubble plots display the enriched Gene Ontology (GO) biological process terms (Bonferroni-corrected P < 0.05) for depression (c), bipolar disorder (d), and schizophrenia (e). The x-axis represents the significance level of each term, while the y-axis lists the GO terms. Bubble color indicates significance, and bubble size represents the number of genes enriched in each term.
Figure 2. Associations of human cortical cells with risk genes for schizophrenia, depression, and bipolar disorder. a-b, UMAP (uniform manifold approximation and projection) visualization of human cortical cells, with cluster labels indicating annotated cell types (a) and developmental stages (b). c, UMAP visualizations display the disease relevance score for schizophrenia, depression and bipolar disorder assigned to each cell. d, Cell type-level scDRS analysis for the three psychiatric disorders. The y-axis represents the -log 10 (P values) of the cell type-level analyses of human cortical cells for the three psychiatric disorders, grouped by cell types and developmental stages (x-axis, with number of cells indicated in parentheses). Asterisks denote significant cell type-disease associations (FDR < 0.05 across 56 cell types in different developmental stages). ExN, excitatory neuron; InN, inhibitory neuron; GPC, glial progenitor cell; Astro, astrocyte; OPC, oligodendrocyte precursor cell; Oligo, oligodendrocyte; Micro, microglia; VASC, vascular cell.
Figure 3. Developmental trajectories of scDRS in human cortical cells for three psychiatric disorders. These plots display the average scDRS (y-axis) for schizophrenia, depression, and bipolar disorder in five major cortical cell types: excitatory neuron (a), inhibitory neuron (b), astrocyte (c), oligodendrocyte precursor cell (OPCs, d), and oligodendrocyte (e). The developmental window spans from the second trimester of gestation to adulthood (x-axis). Prenatal stages for oligodendrocyte were excluded due to low cell counts (n < 50).
Figure 4. Developmental trajectories of scDRS across human cortical cell types for three psychiatric disorders using the top 2,000 disease-related genes. These plots display the average scDRS (y-axis) for schizophrenia, depression, and bipolar disorder in five major cortical cell types: excitatory neuron (a), inhibitory neuron (b), astrocyte (c), oligodendrocyte precursor cell (OPCs, d), and oligodendrocyte (e). The developmental window spans from the second trimester of gestation to adulthood (x-axis). Prenatal stages for oligodendrocyte were excluded due to low cell counts (n < 50).
Peer-review Terminology
Identity transparency: Single anonymized
Reviewer interacts with: Editor
Details
This is an open access article under the terms of the Creative Commons Attribution License(http://creativecommons.org/licenses/by/4.0/), which permits use, distribution and reproduction in any medium, provided the original work is properly cited.
Publication History
Received 2025-09-20
Accepted 2025-10-27
Published 2025-11-11