


Abstract
Background:Amnestic mild cognitive impairment (aMCI), owing to its high prevalence and significant prognostic relevance for
dementia, has become a key focus in the early detection and intervention of neurodegenerative diseases. However, the abnormal
intrinsic brain functional network dynamics in aMCI patients remain inadequately understood.
Methods:A total of 66 participants, comprising 31 aMCI patients and 35 age- and education-matched healthy controls (HCs),
underwent resting-state fMRI scans and comprehensive neuropsychological assessments. This study examined intrinsic brain network
dynamics in aMCI patients via dynamic functional network connectivity (dFNC) analysis, dynamic graph theoretical analysis, and
multilayer network analysis.
Results:Compared with HCs, aMCI patients presented a significantly shorter mean dwell time (MDT) in state 2 (P< 0.05). In
addition, the modularity coefficient Q was significantly greater in aMCI patients (1.40 ± 1.20) than in HCs (0.90 ± 0.46, P< 0.05).
No significant differences were observed between the groups in terms of network efficiency or network switching rates.
Conclusion:These findings emphasize significant abnormal intrinsic brain functional network dynamics in aMCI patients, with
disrupted network stability and increased modularity indicating maladaptive reorganization of brain networks. These results provide
valuable biomarkers for early diagnosis and intervention, contributing to a deeper understanding of the neurobiological
underpinnings of cognitive decline in aMCI patients.
Keywords:aMCI; dynamic functional network; fMRI; multilayer networks; independent component analysis; graph theory.
Introduction
Mild cognitive impairment (MCI) represents an intermediate stage between normal aging and dementia and is characterized by a progressive decline in memory or other cognitive functions without significant impairment in activities of daily living but does not meet the diagnostic criteria for dementia[1]. Amnestic mild cognitive impairment (aMCI), the most common subtype, is likely to progress to dementia, with an 80% probability of progressing within 6 years of diagnosis[2]. Owing to its high prevalence and strong prognostic relevance for dementia, aMCI has emerged as a critical focus for early detection and intervention in neurodegenerative disease research[3].
Functional magnetic resonance imaging (fMRI), especially resting-state fMRI, has become a powerful tool for investigating the intrinsic brain functional network. Numerous studies have demonstrated that aMCI patients exhibit abnormal intrinsic functional connectivity in specific brain networks, such as the default mode network (DMN) and frontoparietal network (FPN), which are closely associated with cognitive impairments[4]. Despite these findings, most existing studies have focused primarily on static functional network connectivity, often overlooking the dynamic and temporally variable nature of intrinsic brain activity[5]. However, brain networks dynamically reorganize their functional connections over time[5], and these dynamic properties may reveal essential neuropathological mechanisms underlying cognitive dysfunction in aMCI patients.
This study investigated abnormal intrinsic brain functional network dynamics in aMCI patients via dynamic functional network connectivity (dFNC) analysis and multilayer network analysis. Unlike traditional static methods, dFNC enables the examination of temporal fluctuations and state transitions in functional connectivity, offering a more nuanced understanding of network instability and adaptability in aMCI patients[6]. These dynamic changes may reflect underlying neuropathological processes that static analyses fail to capture, offering deeper insight into the mechanisms driving cognitive decline. Additionally, examining variability in brain network topology, such as global and local efficiency, reveals disruptions in the brain's capacity for efficient information integration and processing[7]. Disruptions in these topological properties may signal impairments in the ability of the brain to efficiently process and integrate information, which is crucial for maintaining cognitive function[8].
Another key dimension in the study of brain network dynamics is modular organization, which is commonly quantified by the modularity coefficient Q. Modularity reflects the degree to which brain regions are clustered into functionally specialized modules or communities, promoting efficient local processing within modules while enabling integration across the brain[9]. However, alterations in modularity—manifested as either excessive segregation or impaired integration between modules—have been implicated in cognitive decline and neurodegenerative processes[10]. Notably, an increased modularity coefficient Q may signal a shift toward heightened local specialization at the expense of global network coordination, which could hinder the ability of the brain to integrate information and respond adaptively to cognitive demands[9, 11]. In parallel, the rate at which the brain transitions between different network states, termed the network switching rate, serves as an index of network flexibility and adaptability. Frequent and efficient switching is thought to facilitate cognitive flexibility and support dynamic responses to changing environmental or task-related requirements[12]. In aMCI patients, disruptions in modularity and alterations in network switching rates may reflect maladaptive neural reorganization or compensatory mechanisms in response to emerging cognitive deficits.
In summary, this study aims to comprehensively characterize the abnormal intrinsic brain functional network dynamics in aMCI patients via dFNC analysis, dynamic graph theoretic analysis, and multilayer network analysis. These dynamic outcomes have the potential to reveal specific biomarkers for the early detection and monitoring of disease progression, offering new opportunities for personalized interventions. The findings from this study are expected to provide a deeper understanding of how large-scale brain network reorganization contributes to cognitive decline in aMCI patients, thereby informing future clinical strategies for the diagnosis and management of neurodegenerative diseases.
Materials and methods
ParticipantsFor this case‒control study, we initially recruited 110 participants from the Memory Clinic of Yueyang Hospital of Integrated Traditional Chinese and Western Medicine and local communities in Shanghai between January 2022 and October 2022. Ultimately, 31 (28.18%) aMCI patients and 35 (31.82%) healthy controls (HCs) matched for age, sex, and education were included. Approval for the study was obtained from the local ethics committee (NO. 2021-103), and all participants provided informed consent.
The inclusion criteria for the aMCI group were as follows: (1) met the Jak/Bondi diagnostic criteria[13]; (2) had a Mini-Mental State Examination (MMSE) score > 24 points[14]; (3) were aged 55–80 years; (4) had objective memory impairment, Auditory Verbal Learning Test Long-Term Delay Recall (AVLT-N5) and Recognition (AVLT-N7) scores falling below 1.0 standard deviation (SD) from the age-corrected normative mean[15]; (5) had complex Instrumental Activity of Daily Living (IADL) ability that might have been slightly impaired while still maintaining independent daily living[16]; (6) had a Clinical Dementia Rating (CDR) memory score of 0.5 points[17] but did not meet the diagnostic criteria for dementia set by the National Institute on Aging-Alzheimer's Association (NIA-AA)[18]; and (7) were right-handed.
The inclusion criteria for the HCs group were as follows: (1) lacked complaints of cognitive decline; (2) had neuropsychological testing results that did not meet Jak/Bondi's diagnostic criteria[13]; (3) had a normal ability to perform activities of daily living; and (4) lacked a family history of dementia.
The exclusion criteria for all participants were as follows: (1) had a history of mental illness, such as delirium, mania, depression, or anxiety; (2) had contraindications for magnetic resonance imaging (MRI) examination; (3) had less than 6 years of education; (4) had severe aphasia and audio‒visual impairment; (5) had severe medical diseases, such as cardiopulmonary insufficiency, liver, or renal insufficiency; and (6) had other diseases that caused cognitive impairment and white matter hyperintensity lesions, such as cerebrovascular disease, craniocerebral trauma, hydrocephalus, brain tumors, or intracranial infection.
Neuropsychological testingAll participants underwent comprehensive neuropsychological testing conducted by two senior neuropsychologists who were blinded to the clinical diagnosis. General cognitive function was assessed via the MMSE, Montreal Cognitive Assessment-Basic (MoCA-B) and Addenbrooke's Cognitive Examination III (ACE-III)[14, 19, 20]. Memory function was assessed via the AVLT[21], and attention function was assessed via the Symbol Digit Modalities Test (SDMT)[22]. Language function was assessed via the Boston Naming Test (BNT)[23] and Animal Verbal Fluency Test (AFT)[24]. Executive function was assessed via the Stroop test[25], and spatial function was assessed via the Judgment of Line Orientation (JLO) test[26] and Silhouette Test (ST)[27].
Data acquisitionA 3.0 Tesla Magnetom Prisma scanner (Siemens Healthcare, Erlangen, Germany) was used for fMRI scanning, employing a head coil for scans ranging from the cranial vertex to the level of the foramen magnum. During the scan, they were asked to lie quietly in the scanner, close their eyes without falling asleep, and try to keep their heads as still as possible. The detailed fMRI protocols are provided in Supplemental Table 1.
Data preprocessingThe standard pipeline of Statistical Parametric Mapping version 12 (SPM12, https://www.fil.ion.ucl.ac.uk/spm/software/spm12/) was used for resting-state fMRI data preprocessing. This data preprocessing pipeline included the exclusion of the first 10 volumes, slice timing correction, realignment, normalization and smoothing[15].
Group independent component analysisGroup independent component analysis (ICA) was performed on the preprocessed fMRI data via the Group ICA of the Functional MRI Toolbox (GIFT v3.0c, http://icatb.sourceforge.net)[28]. The detailed processing procedure involves the following steps: (1) Principal component analysis (PCA) is applied twice to perform dimensionality reduction on the preprocessed data[29]. (2) The InfoMax algorithm is applied to perform ICA on the PCA-reduced dataset to extract independent components (ICs)[30]. (3) Independent component analysis and stability selection (ICASSO) was applied for 20 repeated iterations to increase the reliability and stability of the ICA results[31], ultimately yielding 17 ICs. (4) Individual-level ICs were extracted from the group ICA back-reconstruction and subjected to Fisher's Z-transformation[32]. (5) The sorting component GUI module in the GIFT software, in conjunction with the maximum spatial overlap of spatial network templates, was employed to select significant ICs and categorize them into distinct functional networks. The selection criteria for ICs were detailed in Supplementary Material 1.
The time series signals corresponding to the ICs mapped to brain functional networks were postprocessed to reduce noise interference: (1) removal of linear, quadratic, and cubic drifts; (2) removal of spike signals; (3) low-pass filtering with a cutoff frequency of 0.15 Hz; and (4) regression of head motion parameters[33].
Dynamic FNC analysisThe GIFT toolbox (v3.0c, http://icatb.sourceforge.net) was utilized to extract the time series of ICs associated with the functional brain networks for dFNC analysis. The time series were segmented into multiple consecutive time windows via the widely applied sliding window approach, with a window length of 44 seconds (55 TRs) and a step size of 1 TR, as this selection has been reported to provide a good balance between the ability to capture dynamic functional connectivity changes and the quality of correlation matrix estimation[34]. On this basis, k-means clustering methods were employed to perform clustering analysis on the dFNC matrix[35]. The L1 distance (Manhattan distance) function was employed to estimate the similarity between different time windows[36], and 500 iterations and 150 repetitions were used to increase the robustness of the results[37]. The optimal number of clusters was determined via the elbow method (k = 4)[37], which involves partitioning the dFNC into four states. For each state, the following temporal features were computed: (1) fraction time (FT): the frequency with which each state occurs during the total duration; (2) mean dwell time (MDT): the average time the subjects remain in each state; (3) number of transitions (NT): the number of transitions between different dynamic states, reflecting the frequency with which the brain network switches from one state to another[33]. Then, a validation analysis was conducted using a window length of 56 seconds (70 TRs) to evaluate robustness. Additionally, edge analysis was conducted for each state to assess the functional connectivity among different brain networks.
Dynamic graph theoretic analysisThe graph theoretical analysis (GRETNA) toolbox (http://www.nitrc.org/projects/gretna/)[38] was applied to conduct graph theoretical variability analysis on the dFNC matrix in each time window. To ensure the sparsity and comparability of the results, a stepwise thresholding method (0.27: 0.01: 0.48) was employed to compute the variations in the graph theory metrics across different sparsity levels[39]. At each sparsity threshold, two categories of graph theory metrics were calculated: global efficiency and local efficiency. The variability of the area under the curve (AUC) for global and local efficiency across all sparsity levels was used to evaluate the dynamic evolution of the brain's functional network topology, thereby avoiding bias associated with selecting a single sparsity threshold[33].
Multilayer modularity and network switching analysisThe functional network connectivity information of each time window is treated as an individual layer, with layers from different time windows interlinked to form a multilayer network. The iterative ordered Louvain algorithm was applied to perform modularity analysis of the network (with parameters gammas = [0.9, 1, 1.1], omegas = 0.5, 0.75, 1)[40]. This algorithm can automatically identify functional modules within the network and compute the modularity coefficient Q, which quantifies the density of different modules and the strength of connections between modules. Additionally, the network transition rate of nodes was computed to assess the dynamic changes and switching patterns of the brain network across functional modules.
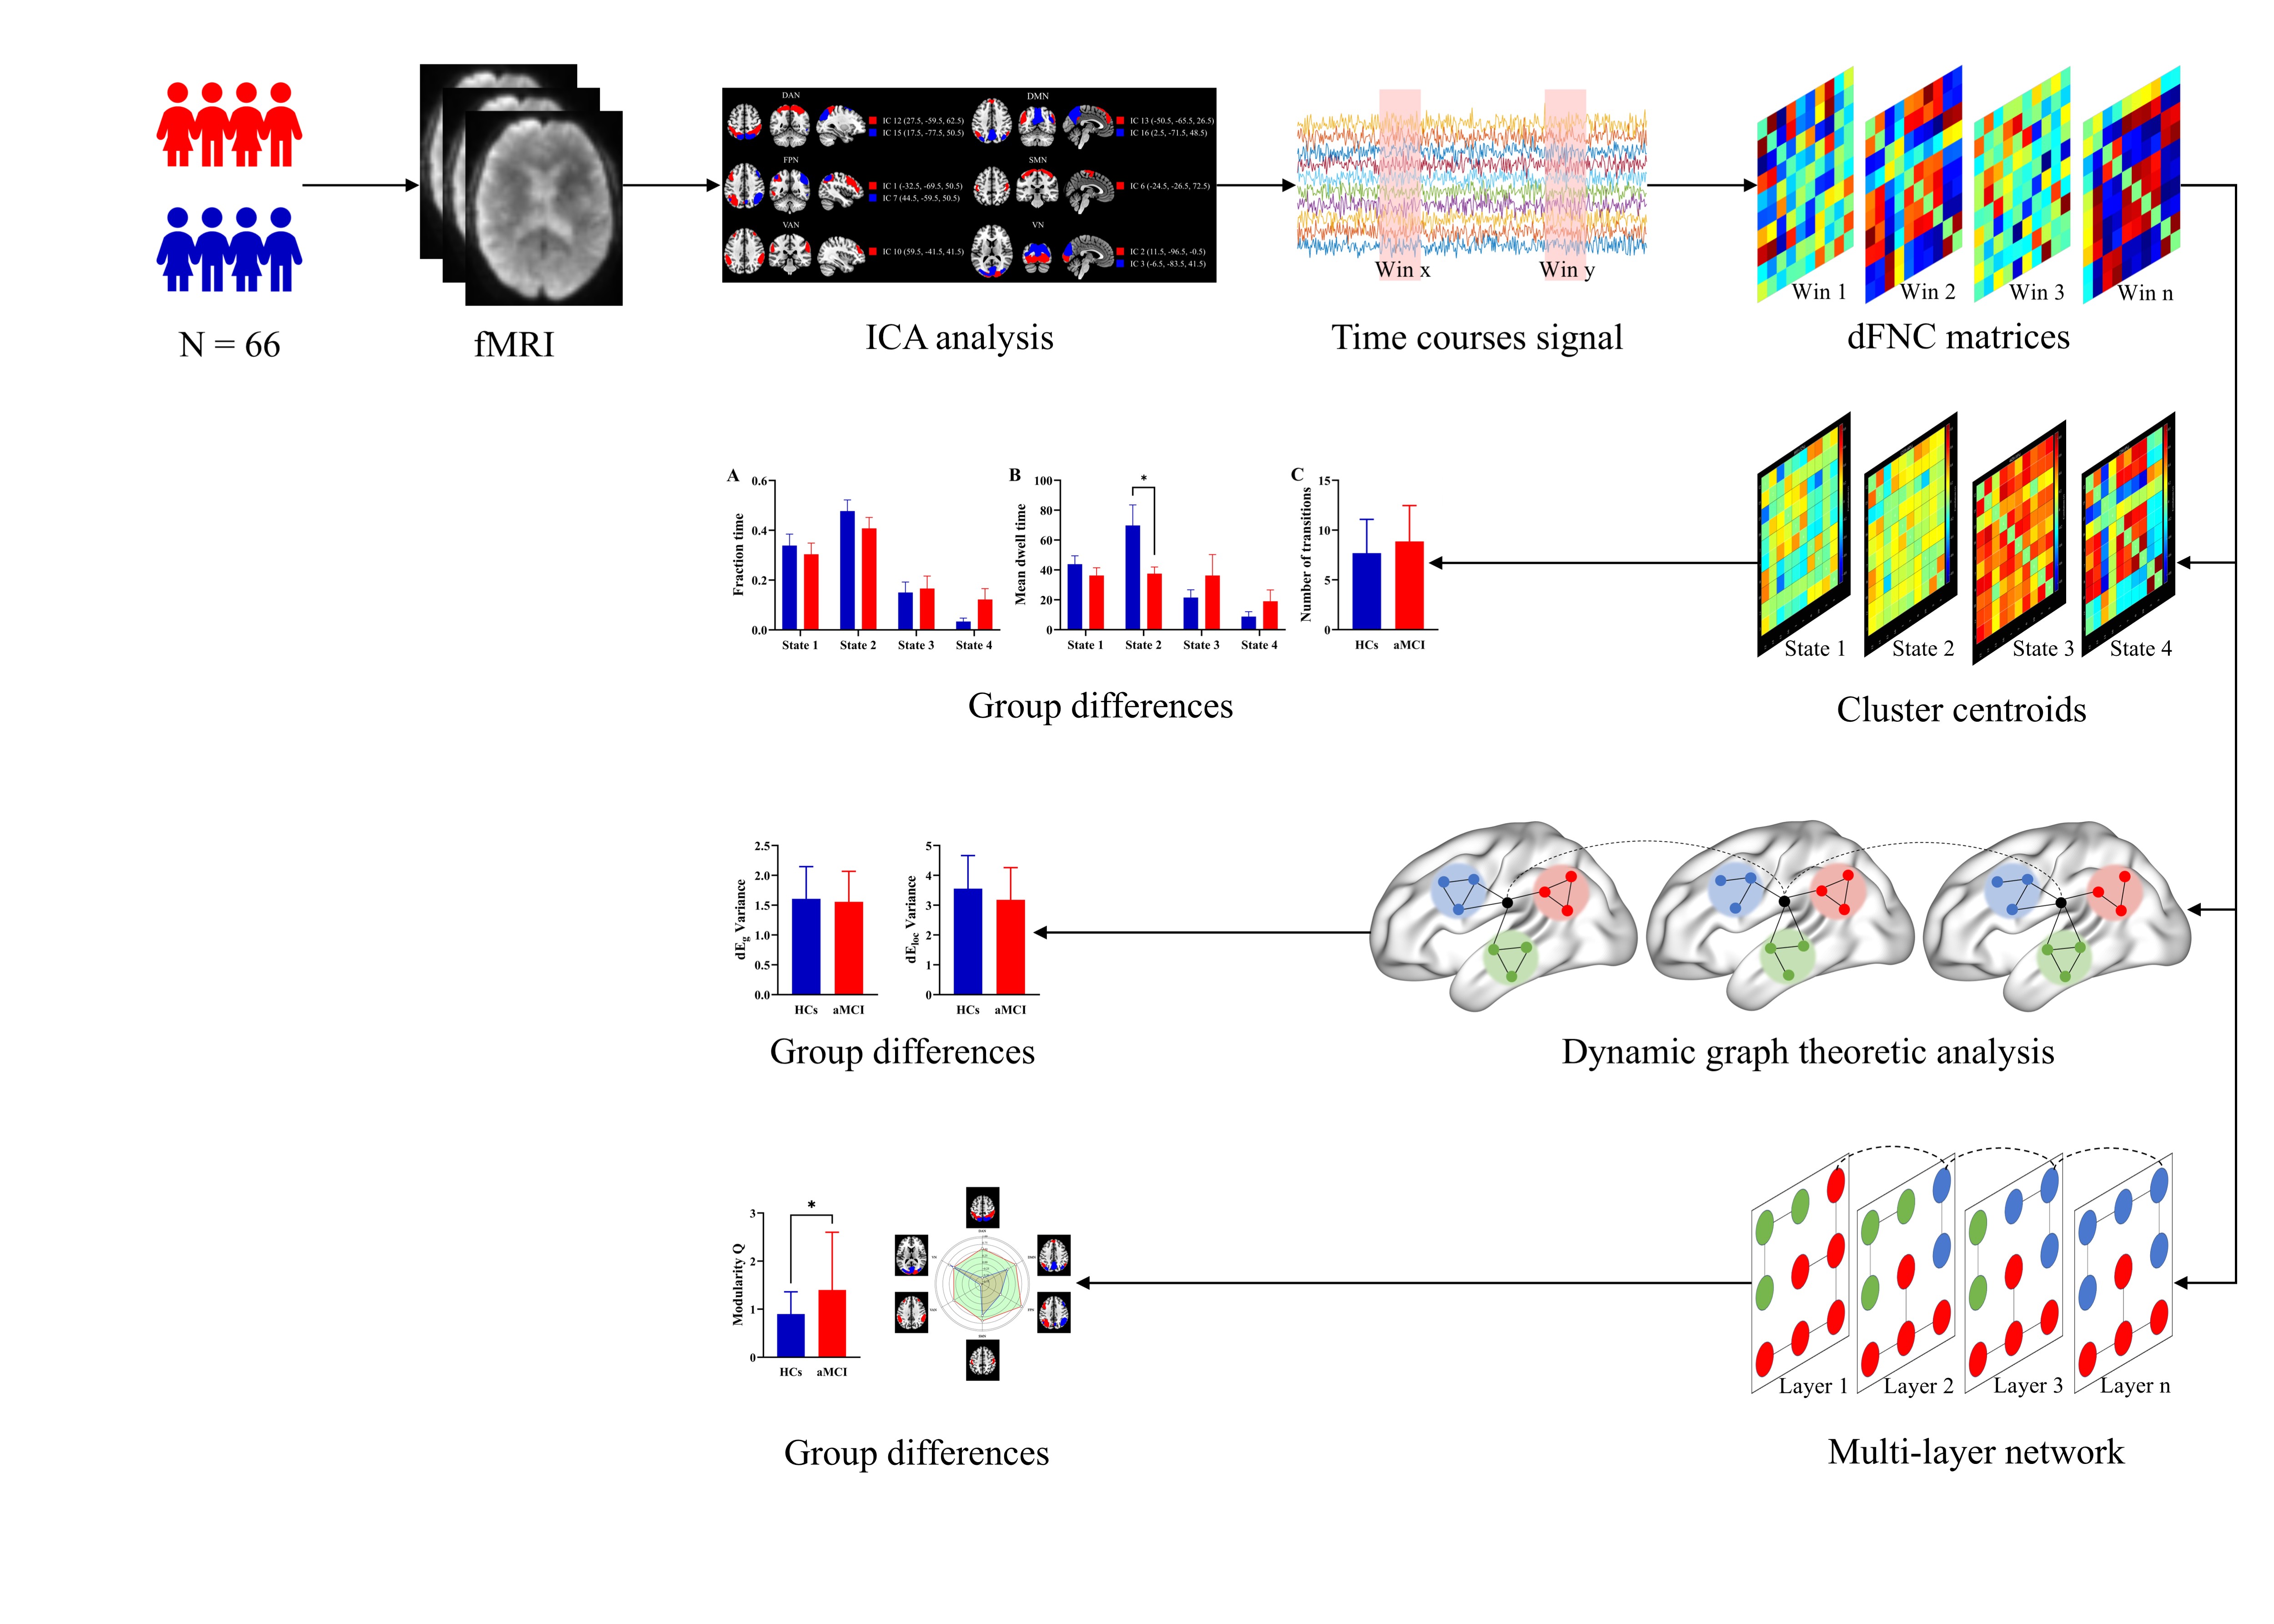
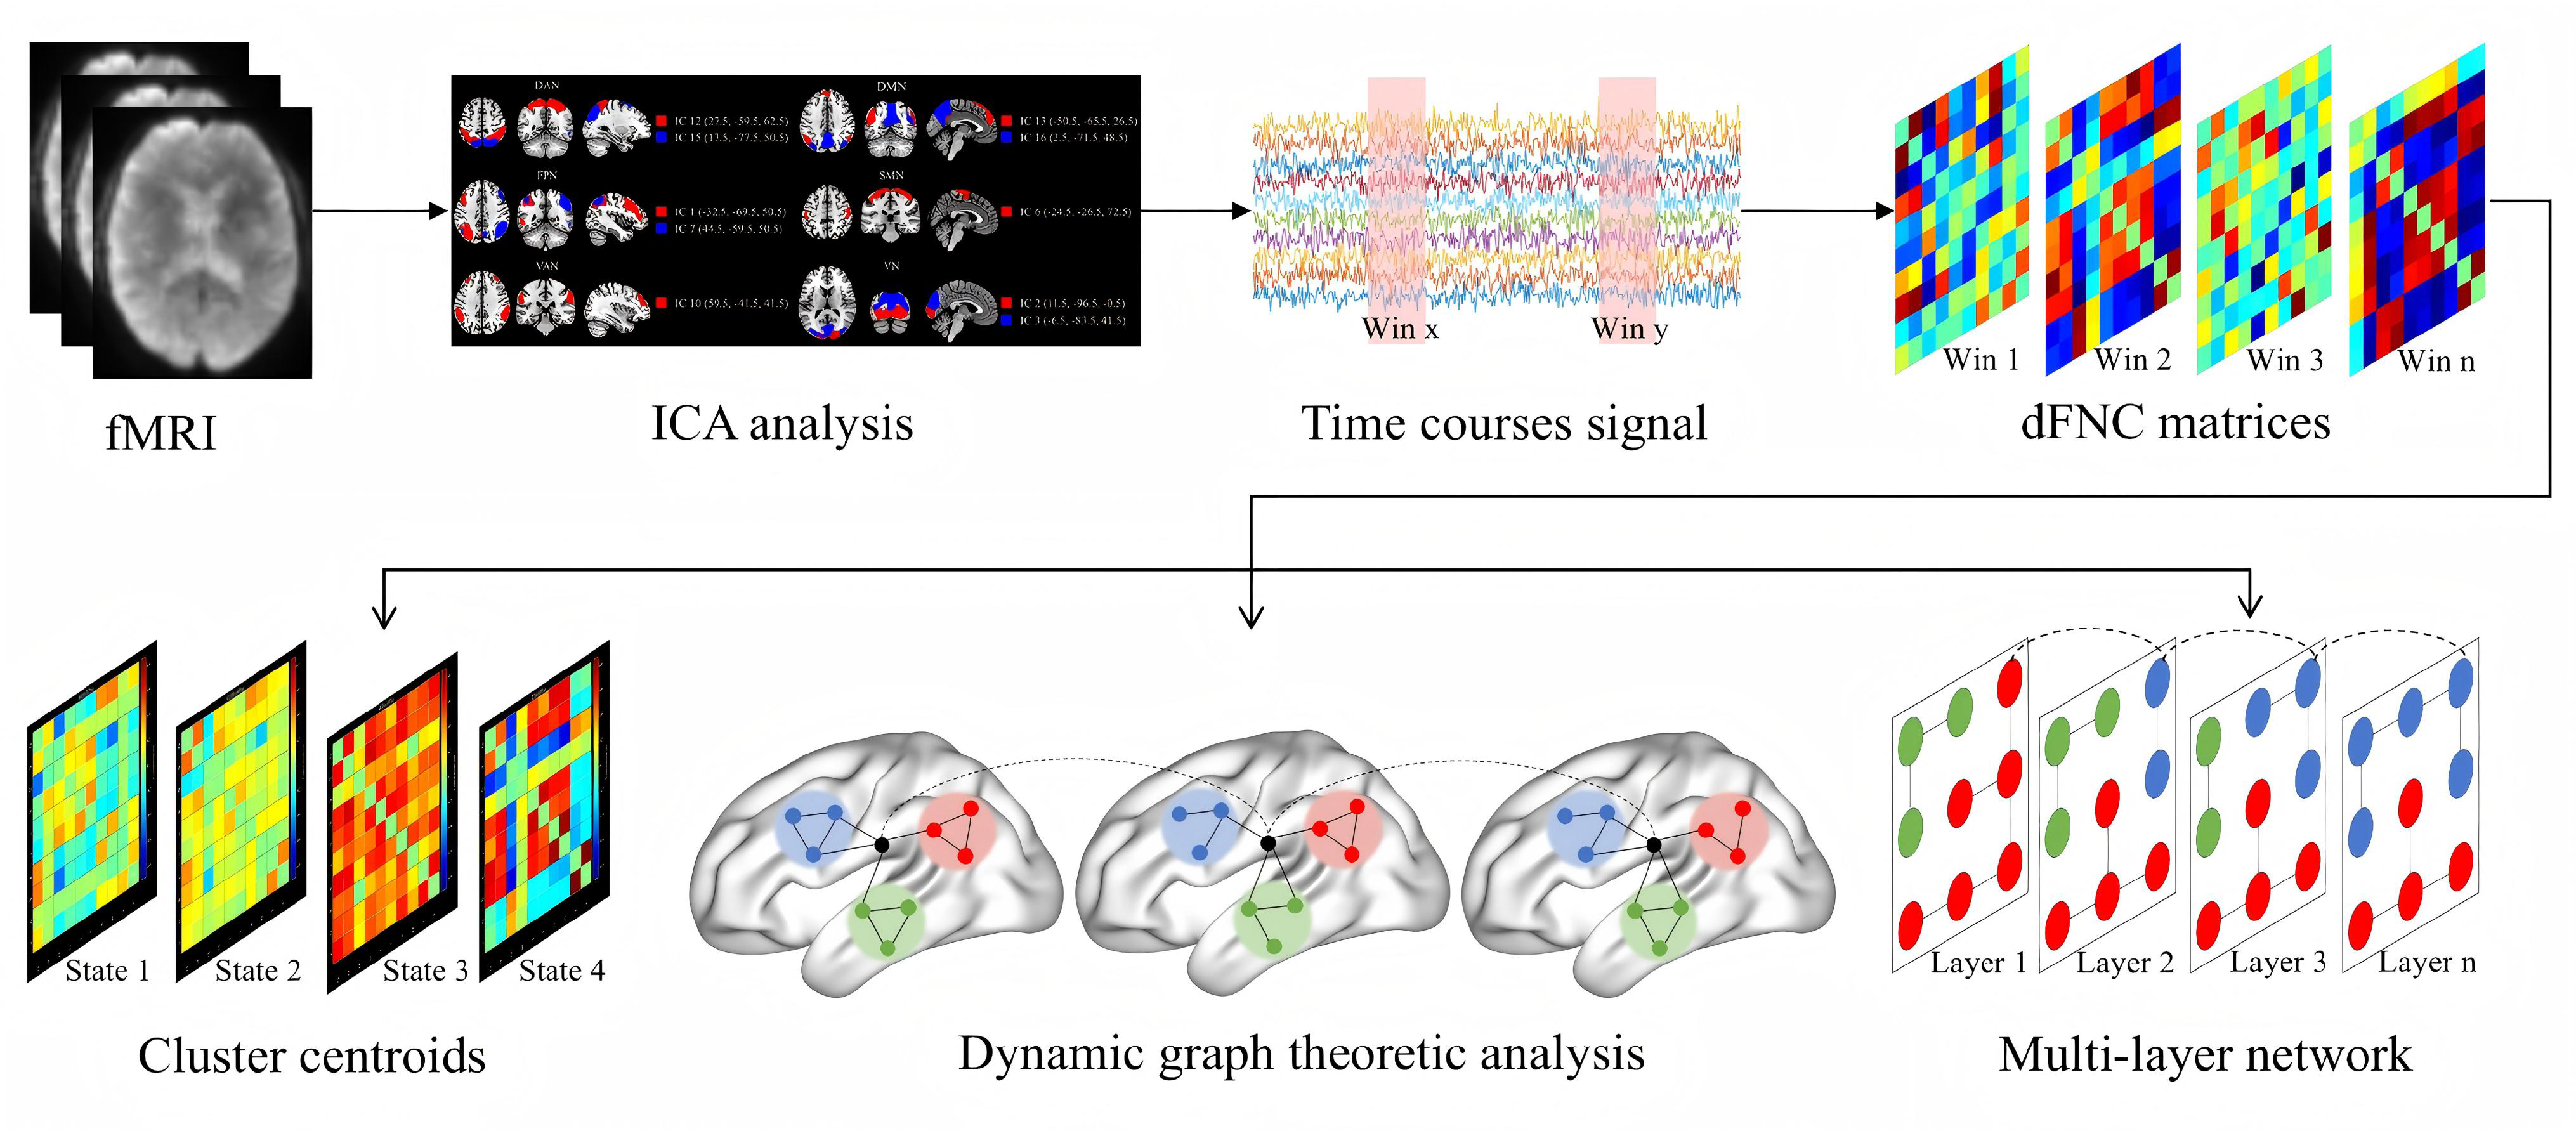
The data processing pipelines are depicted in Figure 1.
Figure 1. Pipelines for data processing. fMRI, functional magnetic resonance imaging; ICA, independent component analysis; dFNC, dynamic functional network connectivity.
Clinical data were analyzed via SPSS software version 27.0 (IBM Corp., Armonk, NY, USA). Intergroup comparisons for continuous variables were performed via the independent two-sample t-test, whereas categorical variables were analyzed via the chi-square (χ²) test. A significance level of P < 0.05 was considered indicative of statistically significant differences between the groups.
The FT, MNT, NT, variability of global and local efficiency, modularity coefficient Q, and network switching analysis were compared between groups via a general linear model, with age, sex, and education included as covariates. Partial correlation analyses were subsequently conducted between the aforementioned group-differentiated network metrics and neuropsychological test scores, with age, sex, and education included as covariates.
Results
Demographic and clinical characteristicsThe baseline characteristics of aMCI patients and HCs are listed in Table 1, including demographic data and cognitive function scores. There was no statistically significant difference in gender, age, height, weight or education between the two groups (P > 0.05). aMCI patients presented impairments in general cognitive function and in multiple specific cognitive domains.
Table 1. Demographics, clinical, and cognitive characteristics
| Characteristics | HCs (N = 35) | aMCI (N = 31) | T/χ² | P |
|---|---|---|---|---|
| Basic characteristics | ||||
| Age (y) | 65.09±6.49 | 67.65±7.32 | -1.505 | 0.137 |
| Education (y) | 11.46±3.13 | 11.74±3.11 | -0.37 | 0.712 |
| Height (cm) | 163.51±6.21 | 161.15±12.17 | 0.914 | 0.367 |
| Weight (kg) | 61.94±9.58 | 62.58±12.24 | -0.223 | 0.824 |
| Gender, male (%) | 8 (22.86%) | 13 (41.94%) | 2.758 | 0.097 |
| Cognitive performance | ||||
| General cognitive function | ||||
| MMSE | 28.43±1.52 | 27.13±1.63 | 3.353 | 0.001 |
| MoCA-B | 26.26±1.99 | 22.52±3.13 | 5.863 | < 0.001 |
| ACE-Ⅲ | 82.49±8.19 | 76.32±6.03 | 3.507 | < 0.001 |
| Memory function | ||||
| AVLT | 60.49±9.63 | 34.42±8.24 | 11.738 | < 0.001 |
| AVLT-N1 | 4.06±1.30 | 2.97±0.89 | 3.869 | < 0.001 |
| AVLT-N2 | 6.86±1.77 | 4.47±0.94 | 6.942 | < 0.001 |
| AVLT-N3 | 8.23±1.59 | 5.23±1.25 | 8.487 | < 0.001 |
| AVLT-N4 | 6.69±1.71 | 2.33±1.37 | 11.181 | < 0.001 |
| AVLT-N5 | 6.37±1.97 | 1.57±1.36 | 11.253 | < 0.001 |
| AVLT-N6 | 6.17±2.42 | 1.90±1.40 | 8.861 | < 0.001 |
| AVLT-N7 | 22.11±1.57 | 17.10±1.77 | 12.118 | < 0.001 |
| Attention function | ||||
| SDMT | 42.40±8.97 | 30.10±13.13 | 4.336 | < 0.001 |
| Language function | ||||
| BNT | 24.24±2.84 | 22.67±4.08 | 1.769 | 0.082 |
| AFT | 18.57±4.34 | 16.35±4.29 | 2.083 | 0.041 |
| Executive function | ||||
| Stroop test-A | 24.00±0.00 | 23.97±0.19 | 1.000 | 0.326 |
| Stroop test-B | 23.20±1.86 | 21.83±2.77 | 2.279 | 0.027 |
| Stroop test-A (s) | 13.84±3.98 | 13.30±2.60 | 0.632 | 0.530 |
| Stroop test-B (s) | 34.78±18.47 | 41.73±10.33 | -1.812 | 0.075 |
| Spatial function | ||||
| JLO | 463.11±32.27 | 380.48±59.78 | 7.098 | < 0.001 |
| ST | 235.37±19.41 | 204.58±43.96 | 3.754 | < 0.001 |
aMCI, amnestic mild cognitive impairment; HCs, healthy controls; MMSE, Mini-Mental State Examination; MoCA-B, Montreal Cognitive Assessment-Basic; ACE-III, Addenbrooke’s Cognitive Examination-III; AVLT, Auditory Verbal Learning Test; AVLT-N1, Auditory Verbal Learning Test, First Immediate Recall; AVLT-N2, Auditory Verbal Learning Test, Second Immediate Recall; AVLT-N3, Auditory Verbal Learning Test, Third Immediate Recall; AVLT-N4, Auditory Verbal Learning Test, Short-Term Delay Recall; AVLT-N5, Auditory Verbal Learning Test, Long-Term Delay Recall; AVLT-N6, Auditory Verbal Learning Test, Long Delay Cued Recall; AVLT-N7, Auditory Verbal Learning Test, Recognition; SDMT, Symbol Digit Modalities Test; BNT, Boston Naming Test; AFT, Animal Fluency Test; JLO, Judgment of Line Orientation; ST, Silhouette Test.
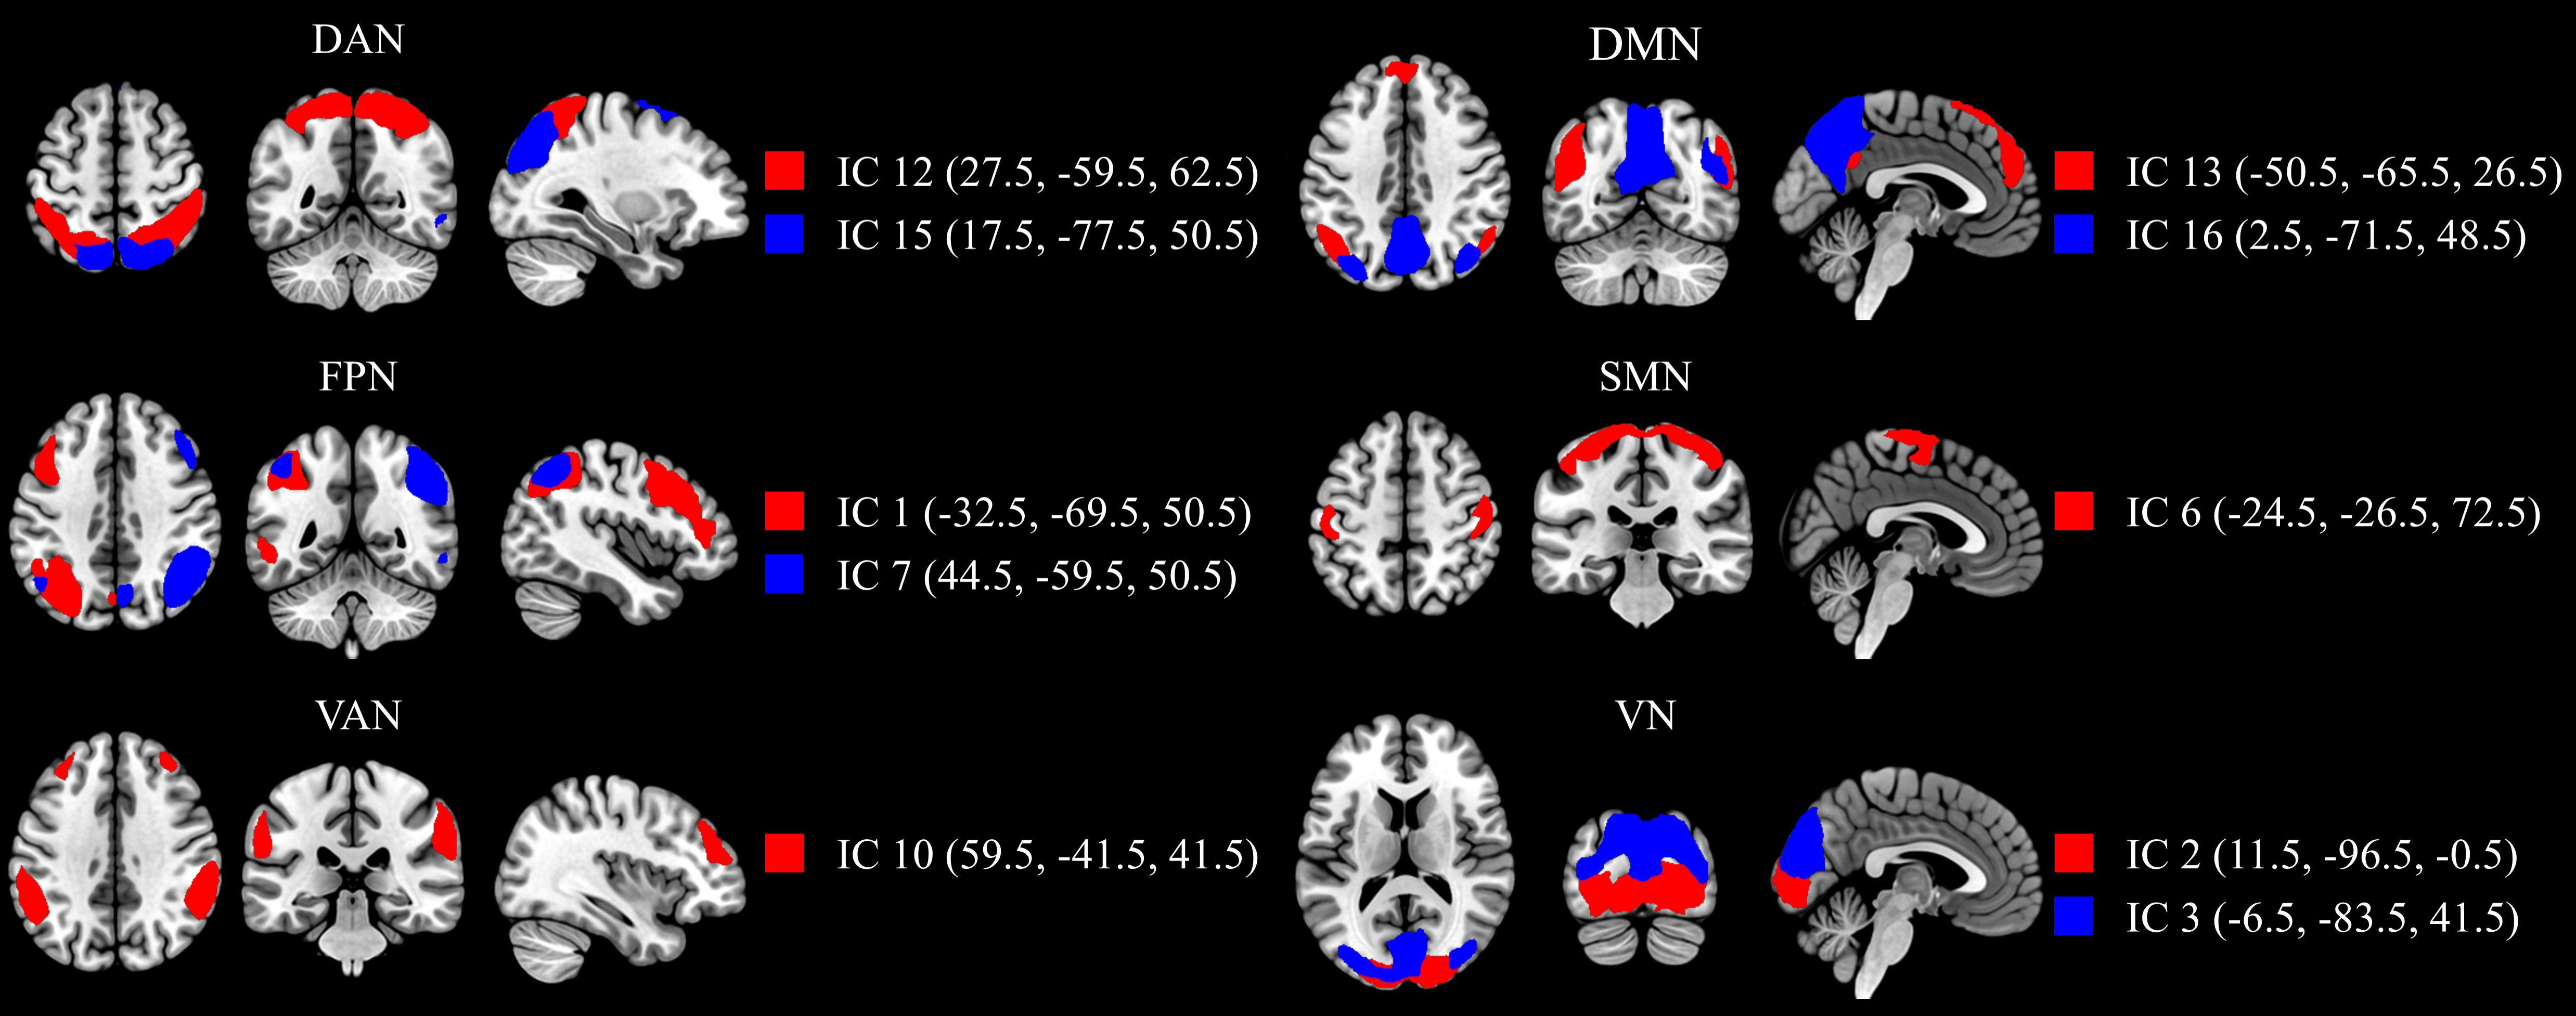
Ten significant independent components (ICs) were identified and assigned to six brain networks (Figure 2): the dorsal attention network (DAN: IC12 and IC15); the default mode network (DMN: IC13 and IC16); the frontoparietal network (FPN: IC1 and IC7); the somatomotor network (SMN: IC6); the ventral attention network (VAN: IC10); and the visual network (VN: IC2 and IC3).
Figure 2. Spatial patterns of the resting-state networks. IC, independent component; DAN, dorsal attention network; DMN, default mode network; FPN, frontoparietal network; SMN, somatomotor network; VAN, ventral attention network; VN, visual network.
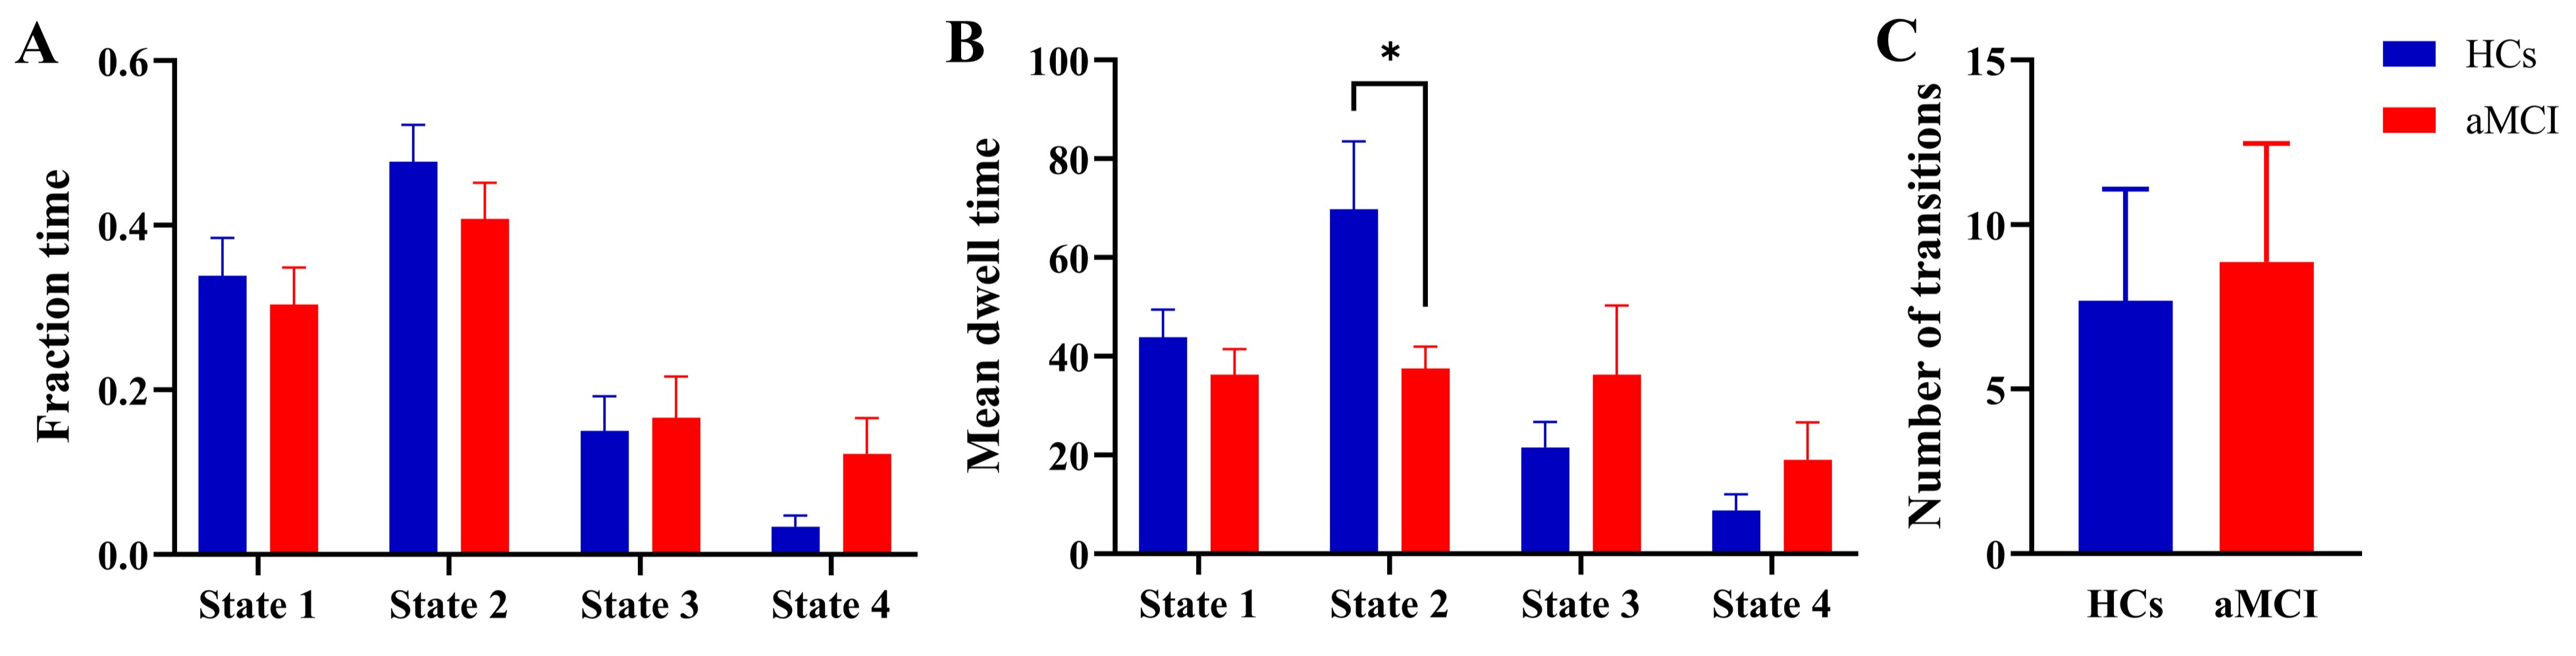
After applying clustering via the k-means algorithm, the optimal number of clusters was determined via the elbow method, resulting in four states (Figure 3): state 1 (32%), state 2 (44%), state 3 (16%), and state 4 (8%). Compared with HCs, the MDT in state 2 was significantly lower in aMCI patients (P < 0.05), whereas no statistically significant differences were observed in the FT or NT across the four states between the two groups (Figure 4, P > 0.05). Partial correlation analysis further revealed a significant positive correlation between MDT in state 2 and completion time on Stroop test A, after controlling for age, sex, and education (r = 0.338, P = 0.007). Additionally, the results of the edge analysis for each state are shown in Supplementary Figure 1.
Figure 3. k-means clustering analysis results. DAN, dorsal attention network; DMN, default mode network; FPN, frontoparietal network; SMN, somatomotor network; VAN, ventral attention network; VN, visual network.
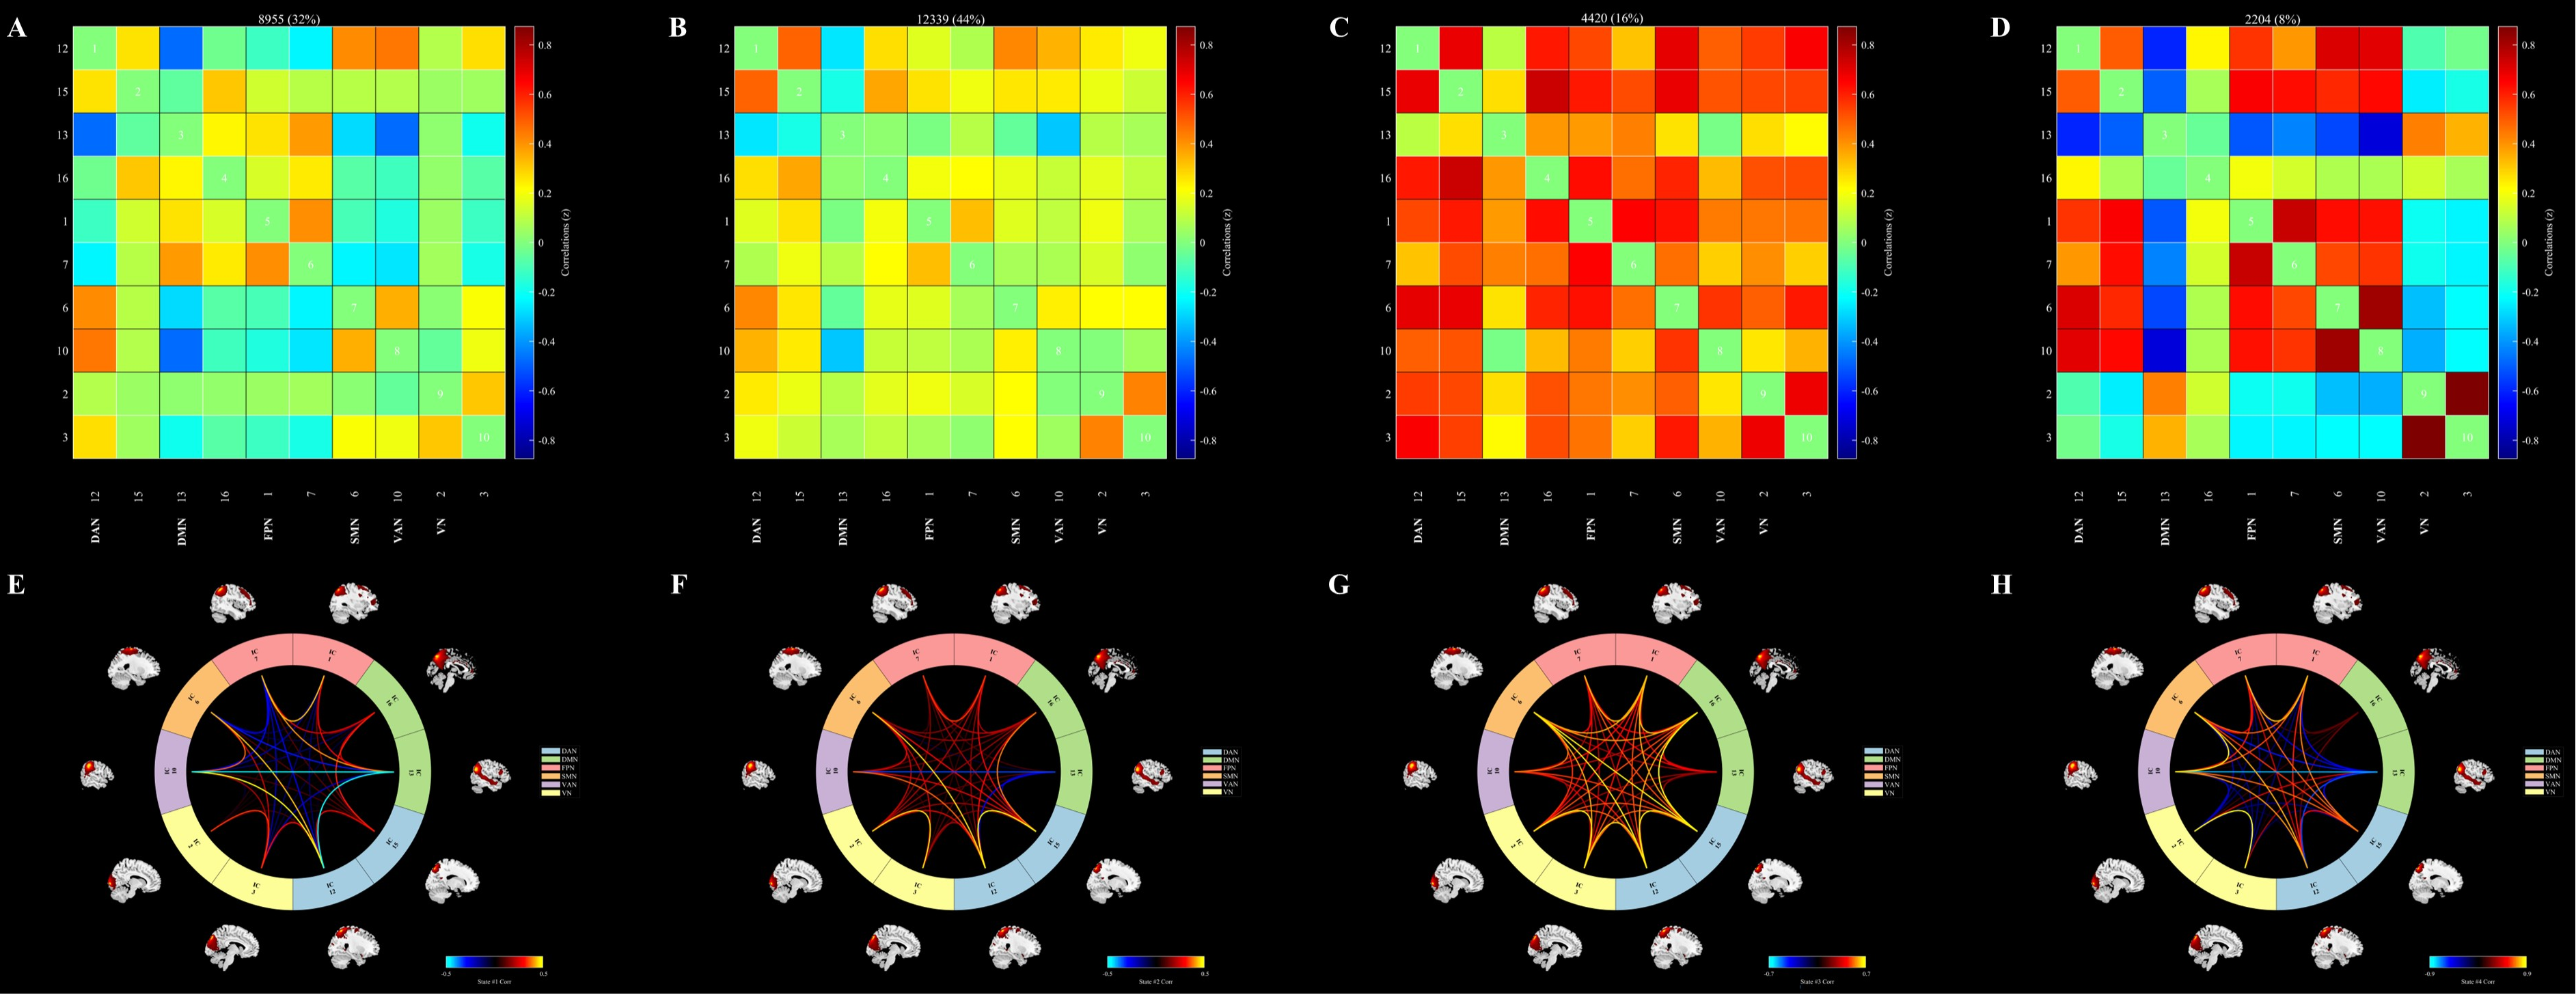
Figure 4. Dynamic temporal properties of dFNC states. aMCI, amnestic mild cognitive impairment; HCs, healthy controls.
Dynamic network topology analysis, which is based on the variance of the dFNC matrix, revealed no significant differences in global or local efficiency between the two groups (Supplementary Figure 2, P > 0.05).
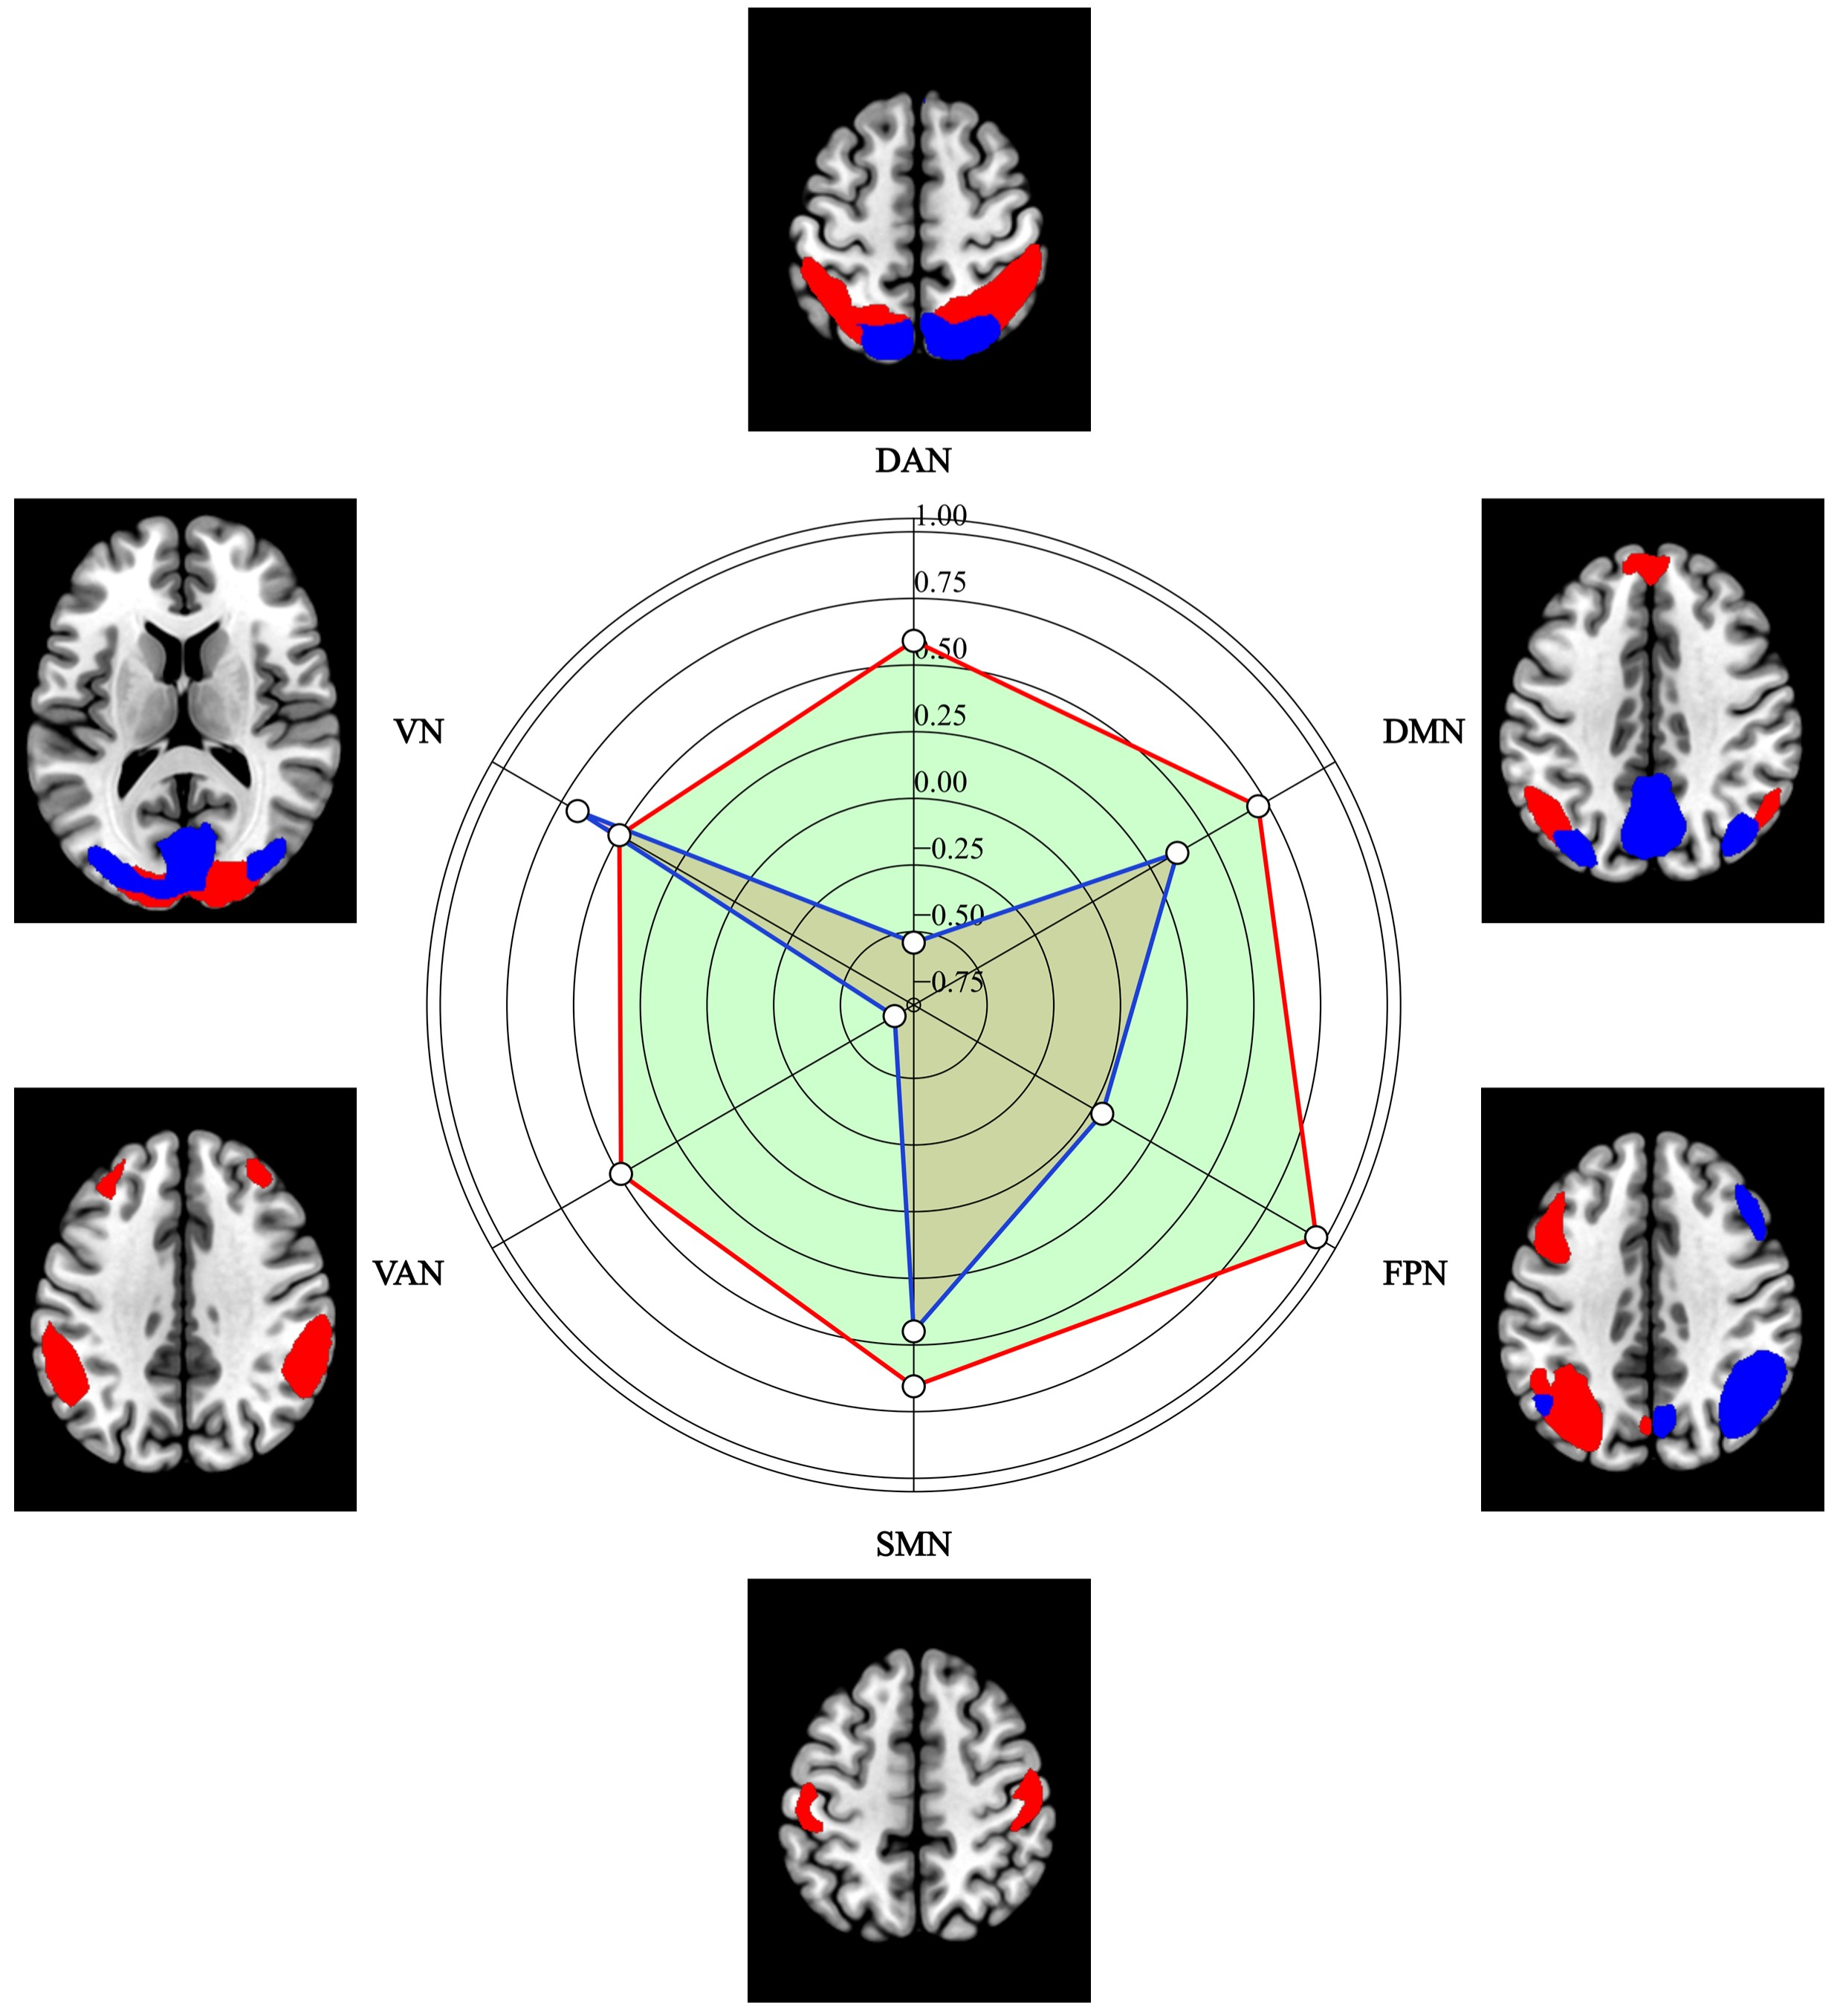
Multilayer modularity and network switching analysisCompared with that in HCs (0.90 ± 0.46), the modularity coefficient Q in aMCI patients (1.40 ± 1.20) was significantly greater (P < 0.05), with gammas = 1 and omegas = 1. Partial correlation analysis further revealed a significant negative correlation between the modularity coefficient Q and the SDMT score after controlling for age, sex, and education (r = -0.349, P = 0.004). However, no significant differences were observed in the network switching rates of the six brain networks between the groups (Figure 5, P > 0.05). The results for additional parameter combinations (gammas = [0.9, 1, 1.1] and omegas = [0.5, 0.75, 1]) can be found in Supplementary Table 2.
Figure 5. Network switching rates of the six brain networks. DAN, dorsal attention network; DMN, default mode network; FPN, frontoparietal network; SMN, somatomotor network; VAN, ventral attention network; VN, visual network.
After applying clustering via the k-means algorithm, the optimal number of clusters was determined via validation analysis with an alternative window length, and findings remained consistent (see Supplementary materials).
In the robustness check using the elbow method, four states were again obtained (Supplementary Figure 3): state 1 (44%), state 2 (10%), state 3 (36%), and state 4 (30%). Compared with HCs, aMCI patients showed significantly lower MDT in state 1 (P < 0.05), while no group differences were observed in FT or NT across the four states (Supplementary Figure 4, P > 0.05).
Discussion
This study investigated the abnormal intrinsic brain functional network dynamics in aMCI patients through the application of dFNC analysis, dynamic graph theory analysis and multilayer brain network analysis. K-means clustering analysis categorized the brain network into four states, with state 2 occupying the largest proportion (44%), in which aMCI patients demonstrated significantly lower MDTs, indicating the reduced stability of the brain network in this state and its strong correlation with cognitive impairment. Although State 4 occurred infrequently (8% dwell time), it presented sparse and weak internetwork connectivity and resembled a transient low-integration configuration. Furthermore, aMCI patients demonstrated a significant increase in the modularity coefficient Q, suggesting that the modular structure of the brain network underwent alterations, potentially indicating an enhancement in local information transmission and a reduction in the coordination of the brain network. Although no significant differences were observed in graph theory variability analysis or network switching rates among aMCI patients, the changes in the modularity coefficient provide novel insights into brain network reorganization and its role in modulating cognitive function. These findings provide important insights into the changes in the brain networks of aMCI patients and their relationships with cognitive dysfunction, identifying potential biomarkers for future research and clinical diagnosis.
In this study, aMCI patients demonstrated a significant decrease in MDT scores in state 2, indicating reduced stability of brain functional network connectivity in this state and potentially indicating a neural network dysregulation mechanism associated with cognitive dysfunction. Further edge analysis revealed that aMCI patients demonstrated marked alterations in the functional connectivity between several key networks in state 2, with reduced connectivity involving mainly the DMN, FPN, DAN, and SMN. Specifically, the reduced connectivity between the DMN and FPN could disrupt the integration of information across internal thinking, self-referential processing, and higher-order executive functions[41, 42], whereas the diminished connectivity between the FPN and SMN may reflect the dissociation between motor execution and cognitive control[43], a dysfunction commonly observed in aMCI patients. Moreover, the reduction in connectivity between the DAN and FPN could further impair the interaction between the regulation of external attention and task-directed control[44]. In contrast, aMCI patients demonstrated enhanced connectivity between the VAN and DMN, potentially indicating a compensatory regulatory mechanism whereby the coupling between the visual-attention system and the spontaneous thinking system is enhanced to sustain some cognitive functions[45]. However, this enhanced VAN–DMN connectivity may reflect a compensatory regulatory mechanism in which the coupling between the stimulus-driven, bottom-up visual attention system and the spontaneous, internally oriented thought system is strengthened to support cognitive function, although its effectiveness and adaptability in aMCI remain uncertain[46, 47]. Overall, the abnormal alterations in the connectivity patterns between these networks may underlie the neural mechanisms underlying the reduced time spent in state 2 by aMCI patients, providing crucial insights into the functional dysregulation of their brain networks.
This study demonstrated a significant increase in the modularity coefficient Q in aMCI patients, suggesting that the modular structure of the brain network underwent alterations. The modularity coefficient Q quantifies the degree of clustering between different functional regions of the brain network, and an increase in the Q value could indicate an improvement in local information transfer[9, 48]. However, this enhanced modular structure could be linked to a reduction in coordination between different brain regions, suggesting impairment of the network's functional integration[49]. In aMCI patients, the increase in the modularity coefficient Q could represent an adaptive reorganization strategy by the brain to compensate for cognitive function loss, but localized processing of information might result in reduced global brain coordination, thereby leading to cognitive dysfunction, particularly in complex tasks, such as memory. In clinical practice, changes in the modularity coefficient Q provide promising biomarkers for the early diagnosis of aMCI, particularly when traditional cognitive assessment tools (such as the MMSE and MoCA) fail to identify subtle changes in brain function, as an increase in the Q value reflects early brain network abnormalities. In addition, the increase in the modularity coefficient Q is strongly inversely correlated with the decline in cognitive function, particularly attention, which further suggests that the modular alterations in the brain network are closely linked to cognitive impairment in aMCI patients.
Although significant differences were observed in the modularity coefficient Q, no notable differences were found in the dynamic network topology or network switching rates among aMCI patients. Dynamic network topology analysis provides assessments of the global and local efficiencies of the brain network as it changes over time, which may reveal the stability of neural connectivity and the efficiency of information transfer[50]. However, our results revealed no significant differences in these metrics between aMCI patients and healthy controls, suggesting that despite alterations in the modular structure of the brain network in aMCI patients, the overall efficiency of network connectivity has not been significantly compromised. This finding could suggest the brain's capacity for adaptation under various cognitive states, particularly since no apparent impairment in task-switching ability or processing speed was observed. This finding may also correlate with the reduction in MDT observed in state 2 of the dFNC analysis, indicating that while aMCI patients exhibit poorer network stability, the brain remains capable of preserving a certain level of network efficiency and adaptability. Therefore, while dynamic network topology analysis did not reveal significant group differences, the changes in the modularity coefficient Q provide a clearer understanding of network functional reorganization and cognitive decline in aMCI patients. Future research should further explore the underlying mechanisms and clinical implications of these findings.
Despite the important insights yielded by this study into the abnormal intrinsic brain functional network dynamics in aMCI patients, several limitations should be acknowledged. First, the relatively small sample size may reduce the statistical power and limit the generalizability of the findings. Larger cohorts are needed to validate these observations and explore potential subtype differences within aMCI patients. Second, while this study employed sliding-window analysis to examine dynamic functional connectivity, the cross-sectional design precludes investigation of how these network dynamics evolve over time. Longitudinal studies with repeated neuroimaging and cognitive assessments are necessary to track the temporal trajectory of network changes and clarify their role in predicting disease progression. Third, although age, sex, and education were controlled as covariates, other potentially influential factors—such as genetic risk (e.g., APOE status), vascular health, sleep quality, subthreshold depressive symptoms and lifestyle factors—were not assessed and may confound the observed associations. Finally, the study was conducted at a single center within a limited geographic region, which may introduce selection bias. Future multicenter studies involving more demographically and ethnically diverse populations are warranted to enhance the external validity of the findings.
Conclusion
In conclusion, this study provides valuable insights into the abnormal intrinsic brain functional network dynamics in aMCI patients, highlighting significant alterations in brain network connectivity, particularly in dFNC, the modularity coefficient Q, and network topology. These findings suggest that aMCI patients exhibit reduced stability in certain brain network states, particularly in state 2, as indicated by decreased MDT and alterations in modularity that reflect a shift in the brain's network organization. Despite the lack of significant differences in global network efficiency, the increase in modularity and its correlation with cognitive decline point to the potential of using network metrics, such as the modularity coefficient Q, as biomarkers for the early diagnosis and monitoring of aMCI. These results underscore the importance of dynamic brain network analysis in understanding the neurobiological underpinnings of cognitive dysfunction in aMCI patients and provide a foundation for future longitudinal studies and clinical applications to track disease progression and develop targeted interventions. However, further research with larger, more diverse cohorts and longitudinal designs is needed to validate these findings and explore their clinical utility in real-world settings.
Abbreviations
aMCI: amnestic mild cognitive impairment; HCs: healthy controls; dFNC: dynamic functional network connectivity; MDT: mean dwell time; MCI: mild cognitive impairment; fMRI: functional magnetic resonance imaging; DMN: default mode network; FPN: frontoparietal network; MMSE: mini-mental state examination; AVLT-N5: auditory verbal learning test, long-term delay recall; AVLT-N7: auditory verbal learning test, recognition; SD: standard deviation; IADL: instrumental activity of daily living; CDR: clinical dementia rating; NIAAA: national institute on aging alzheimer's association; MRI: magnetic resonance imaging; MoCAB: montreal cognitive assessment-basic; ACE-III: addenbrooke's cognitive examination III; SDMT: symbol digit modalities test; BNT: boston naming test; AFT: animal verbal fluency test; JLO: judgment of line orientation; ST: silhouette test; ICA: independent component analysis; GIFT: group ICA of the functional MRI toolbox; PCA: principal component analysis; ICs: independent components; ICASSO: independent component analysis and stability selection; FT: fraction time; NT: number of transitions; GRETNA: graph theoretical analysis; AUC: area under the curve;
Supplementary Materials
Declarations
Author Contributions
The specific contributions to this study are as follows: Ling-Ling Li: Writing – original draft, Methodology. Jia-Jia Wu: Methodology, Project administration, Writing – review & editing. Mou-Xiong Zheng: Methodology, Project administration, Writing – review & editing. Xin Xue: Formal analysis, Investigation, Methodology. Jie Ma: Conceptualization, Funding acquisition, Project administration, Supervision. Xu-Yun Hua: Conceptualization, Funding acquisition, Project administration, Supervision. Jian-Guang Xu: Conceptualization, Funding acquisition, Project administration, Supervision. All authors have reviewed and approved the final manuscript for submission.
Acknowledgements
The authors thank all the participants who participated in this study.
Funding information
This work was supported by the National Key R&D Program of China (Grant Nos.: 2018YFC2001600, and 2018YFC2001604); National Natural Science Foundation of China (Grant Nos.: 82272583, 82172554, 82272589, 81871836, 82302870 and 82472589); Shanghai Health Care Commission (Grant No.: 2022JC026); Shanghai Science and Technology Committee (Grant No.: 22010504200); Shanghai Rising-Star Program (Grant No.: 23QA1409200 and 24QA2709300); Shanghai Youth Top Talent Development Plan; Shanghai “Rising Stars of Medical Talent” - Distinguished Young Medical Talent Program; Shanghai Talent Development Fund (2021074), Science & Technology Development Fund of Shanghai University of Traditional Chinese Medicine (Grant No.: 23KFL112); High-level Chinese Medicine Key Discipline Construction Project (Integrative Chinese and Western Medicine Clinic) of National Administration of TCM (zyyzdxk-2023065); Shanghai Hospital Development Center Foundation-Shanghai Municipal Hospital Rehabilitation Medicine Specialty Alliance (SHDC22023304); Shanghai Oriental Talents Program (QNJY2024077).
Ethics Approval and Consent to Participate
Approval for the study was obtained from the institutional ethics committee (NO. 2021-103), and all participants provided informed consent.
Competing Interests
The authors declare no conflicts of interest.
Data availability
The original contributions presented in the study are included in the article/supplementary material; further inquiries can be directed to the corresponding author.
References
 Figures
 References
 Peer
Peer Information
Figure 1. Pipelines for data processing. The workflow includes preprocessing, group ICA to extract resting‑state networks, dynamic FNC estimation via sliding windows, k‑means clustering of recurrent states, and multilayer modularity to assess network switching.
Figure 2. Spatial patterns of resting‑state networks identified by group ICA, including DMN, ECN, SN, limbic/hippocampal, sensorimotor, visual, and auditory networks.
Figure 3. k‑means clustering analysis of dFNC states. Representative centroids depict distinct connectivity patterns; group‑wise comparisons highlight altered DMN–ECN–SN coupling in aMCI.
Figure 4. Dynamic temporal properties of dFNC states. Group comparisons of fractional occupancy, mean dwell time, and number of transitions across identified states.
Figure 5. Network switching rates across resting‑state networks derived from multilayer modularity analysis. aMCI shows elevated switching in DMN and ECN compared to controls.
[9] Sporns O, & Betzel RF. (2016). Modular Brain Networks. Annu Rev Psychol, 67, 613-640.
[35] Lloyd SJItoit. (1982). Least squares quantization in PCM. 28(2), 129-137.
[41] Menon V. (2021). Dissociation by Network Integration. Am J Psychiatry, 178(2), 110-112.
Peer-review Terminology
Identity transparency: Single anonymized
Reviewer interacts with: Editor
Details
This is an open access article under the terms of the Creative Commons Attribution License(http://creativecommons.org/licenses/by/4.0/), which permits use, distribution and reproduction in any medium, provided the original work is properly cited.
Publication History
Received 2025-07-16
Accepted 2025-10-08
Published 2025-10-25